Figures & data
Figure 1. Distribution of the Logarithmically Transformed Blood Lead Concentration. M, S and K indicate the mean and the coefficients of skewness and kurtosis. The solid and dotted lines represent the normal and kernel density distributions. The p value is for departure of the actually observed distribution from normality according to the Shapiro-Wilk test.
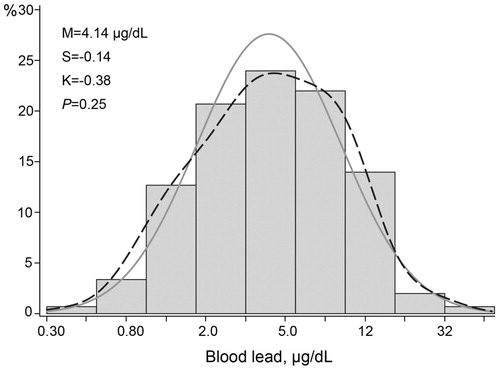
Table 1. Characteristics of workers by the median of the blood lead distribution.
Table 2. Central hemodynamic measurements by median of the blood lead distribution.
Figure 2. Association of central systolic pressure (A), central diastolic pressure (B) and central pulse pressure (C) with blood lead. For each association the adjusted regression line with 95% confidence interval was depicted. The models accounted for ethnicity, age, body height, body weight, the waist-to-hip ratio, smoking and drinking, and the total-to HDL cholesterol ratio.
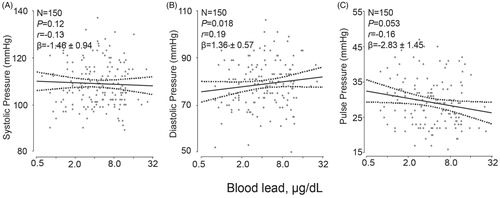
Table 3. Associations of hemodynamic measurements with blood lead.
Figure 3. Association of the augmentation ratio (A), augmentation index (B) and pressure amplification (C) standardized to a heart rate of 65 beats per minute with blood lead. The augmentation ratio was the ratio of the second over the first peak of the central blood pressure wave. The augmentation index was the absolute difference between the second and first peak over central pulse pressure. Pressure amplification was the ratio of peripheral over central pulse pressure. The ratios were expressed in percent and standardized to a heart rate of 65 beats per minute. For each association the adjusted regression line with 95% confidence interval was depicted. The models accounted for ethnicity, age, body height, body weight, the waist-to-hip ratio, mean arterial pressure, smoking and drinking, and the total-to HDL cholesterol ratio.
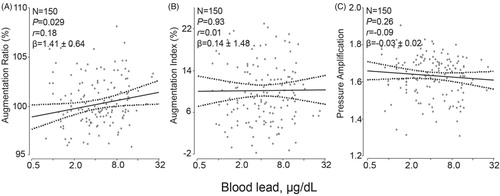
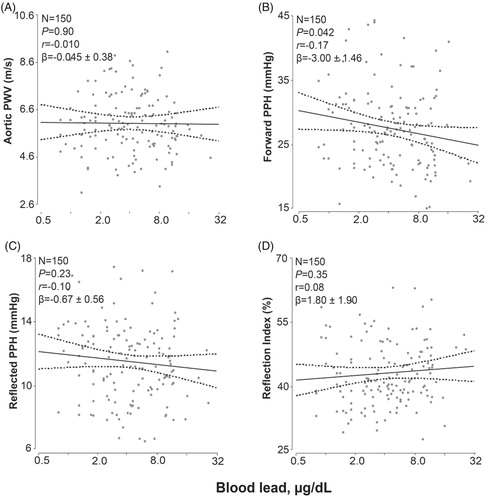
Figure 4. Association of the aortic pulse wave velocity (A), the forward pulse pressure height (B), the reflected pulse pressure height (C) and the reflection index (D) standardized to a heart rate of 65 beats per minute with blood lead. The forward and backward pulse pressure amplitudes were derived from the central pulse wave by a triangular-flow pressure-based wave separation algorithm. The reflection index was the ratio of the backward to the forward pulse pressure amplitude expressed as percentage. The measurements were standardized to a heart rate of 65 beats per minute. For each association the adjusted regression line with 95% confidence interval was depicted. The models accounted for ethnicity, age, body height, body weight, the waist-to-hip ratio, mean arterial pressure, smoking and drinking, and the total-to HDL cholesterol ratio.