
Figures & data
Figure 1. Flowchart illustrating the outline of the Oslo RDN study and the two groups; the Renal Denervation group, and the Drug Adjustment group. The box containing ‘1 y + drug adjustment’ denotes in the RDN group the start of drug adjustment in this group. The dotted lines illustrate a planned follow-up visit 10 years after randomisation.
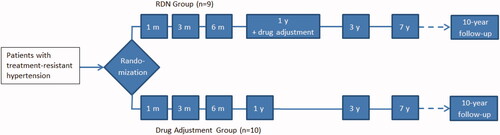
Table 1. Group characteristics at randomisation.
Table 2. Group comparisons of use of antihypertensive agents during 7 years of follow-up.
Figure 2. Long-term Office Blood Pressure in each of the two groups. The x-axis plots time, with each study visit marked separately. The y-axis denotes blood pressure in mmHg and is truncated. The blue lines indicate the systolic (upper line with circular points) and diastolic (lower line with square points) blood pressure of the Renal Denervation group. The red lines with (opposite) triangular symbols indicate the same for the Drug Adjustment group. The asterisk denotes statistical difference between the groups at the corresponding visit.
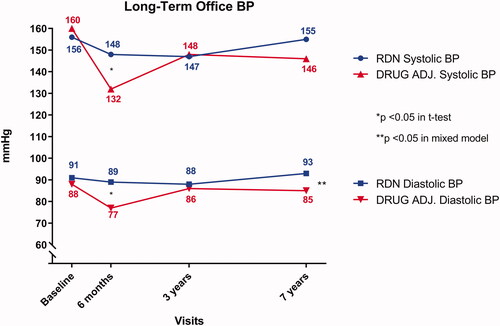
Figure 3. Long-term daytime Ambulatory Blood Pressure in each of the two groups. The x-axis plots time, with each study visit marked separately. The y-axis denotes blood pressure in mmHg and is truncated. The blue lines indicate the systolic (upper line with circular points) and diastolic (lower line with square points) blood pressure of the Renal Denervation group. The red lines with (opposite) triangular symbols indicate the same for the Drug Adjustment group. The asterisk denotes statistical difference between the groups at the corresponding follow-up visit.
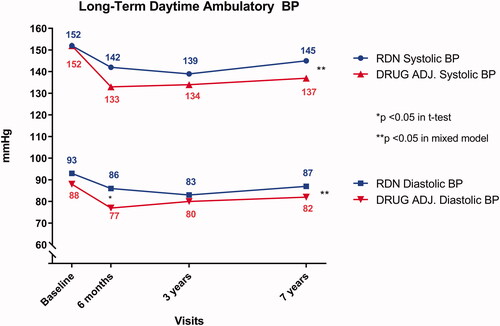
Table 3. Group comparisons of blood pressure, demographic variables, biochemistry and renal function during 7 years of follow-up.