
Figures & data
Figure 1. Outline of the Eromanga Basin and associated Mesozoic basins. The red square approximately marks the area under consideration of northern Flinders Ranges and adjacent lowlands. Modified from Alexander and Cotton (Citation2006).
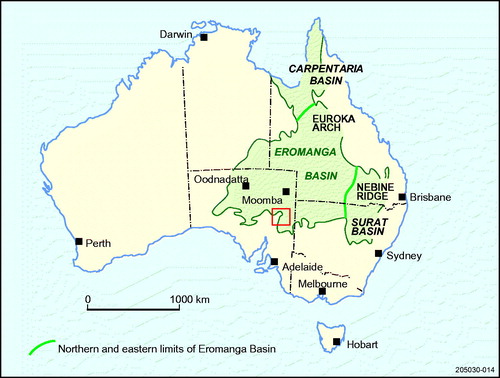
Figure 2. Chronostratigraphy of the broader Eromanga Basin showing the palynological zones (spore-pollen and microplankton after Helby et al., Citation1987; modifications after Alley et al., Citation2006) used in dating the succession. Where Coorikiana Sandstone is not present, the Aptian–Albian shale succession is referred to as Marree Subgroup.
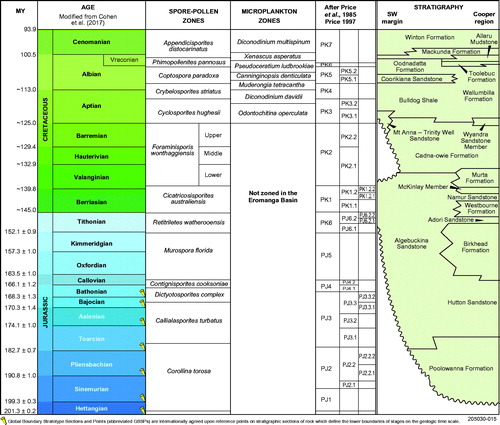
Figure 3. General geology map (2-mile scale) of the northern Flinders Ranges and adjacent lowlands. Modified from SARIG, February 2018. The names of the key outcrop sites (numbers) and drill holes (letters) are given in .
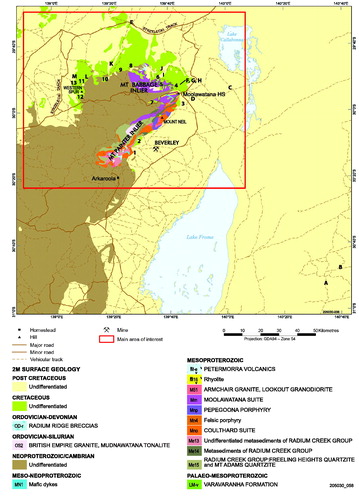
Figure 4. Position of the Australian plate during Late Jurassic to Cenomanian. Red square marks approximate position of study area. (a) 160 Ma, Late Jurassic; (b) 132.5 Ma, Early Cretaceous (Valanginian); (c) 118 Ma, Early Cretaceous (Aptian); and (d) 96 Ma, Late Cretaceous (Cenomanian). Modified from Alexander et al. (Citation2006) who used Veevers, Powell and Roots (Citation1991) and Baillie, Powell, Li and Ryan (Citation1994) as a source.
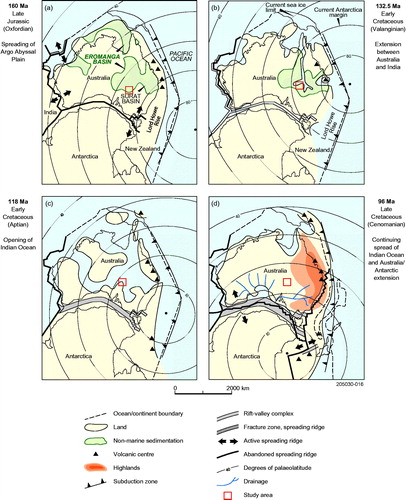
Figure 5. Terminus of the Great Glacier, northwestern British Columbia, Canada. Piedmont glacier, with valley glacier section up valley, terminating in a lake. Large icebergs, the larger measuring 200–300 m long, are calving from the glacier terminus. Dark areas on glacier and icebergs are suprglacial moraine. Dark streaks in upper right part of the lake are sediment plumes. Forested Neoglacial terminal moraine with lakes between the morainal ridges. Scale of lake in which glacier terminates is 6.7 km across, the piedmont ice spread 4 km across and valley glacier up valley is 1.3 km across. On a smaller scale this is the potential model for glaciers depositing the Livingston Tillite and Sheehan Tillite members. Photo taken 1977.
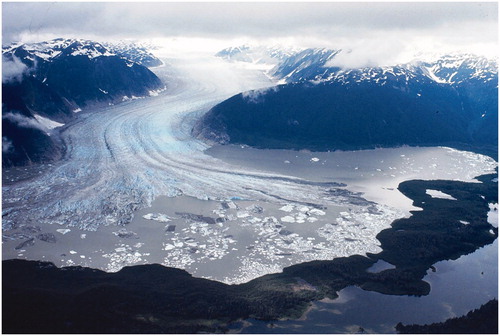
Figure 6. Formation of flowtills in a proglacial ice-contact setting.
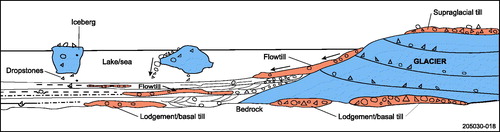
Figure 7. Diagrammatic representation of the stratigraphic setting of the Livingston Tillite Member and the distribution of ice-rafted debris in the Cadna-owie Formation.
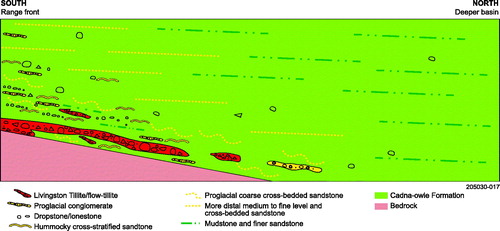
Figure 8. Stratigraphy of the southern Eromanga Basin. Age ranges of the stratigraphic units in the southern Eromanga Basin are based on palynological dating from key drill holes and outcrop. Stratigraphy of the greater Eromanga Basin within South Australia presented in right-hand column.
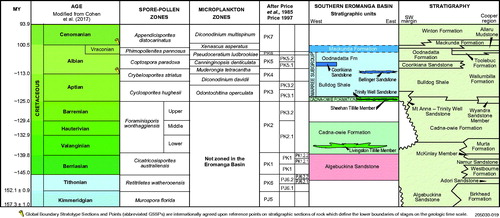
Figure 9. Litholog for the Livingston Tillite Member at the type section. Enlargement on right of figure shows the facies now included in the member.
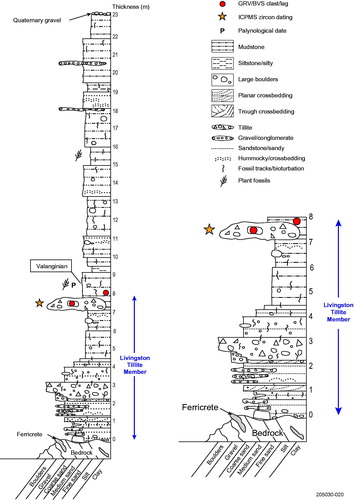
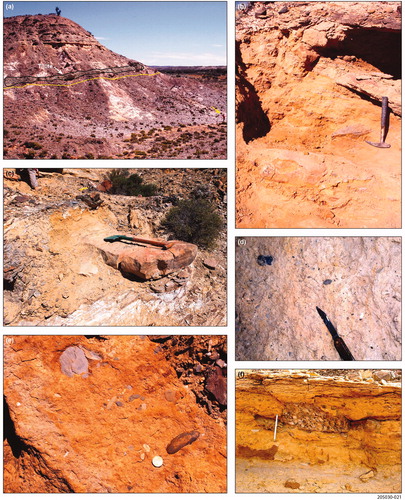
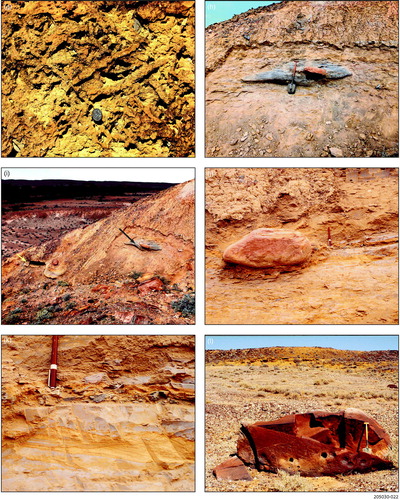
Figure 11. Quartz grain micromorphology, Livingston Tillite Member at the type section. (a) Sharp edged grain exhibiting multiple conchoidal fractures. Type section at Recorder Hill site. (b) Subangular grain with conchoidal fractures and slightly lifted plates. (c) Conchoidal fracture on sharp edged grain. (d) Grain exhibiting chatter mark (in upper right rectangle) and striae (orientation shown on left rectangle by lines), groove shown by arrow. (e) Grooving and striae along a smoothed surface, with orientation shown by arrow.
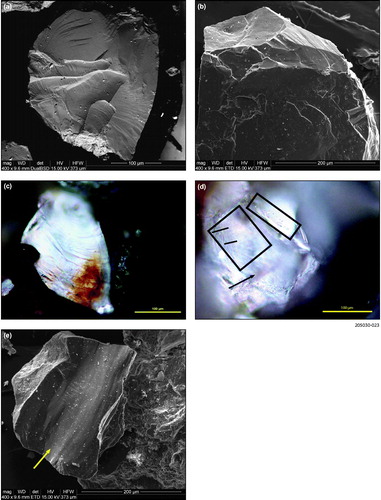
Figure 12. Litholog for Petromin 169121 610 8 drill hole located some 7 km west of Recorder Hill. Log based on our observations and driller’s log (Petromin, Citation1971a, Citation1971b).
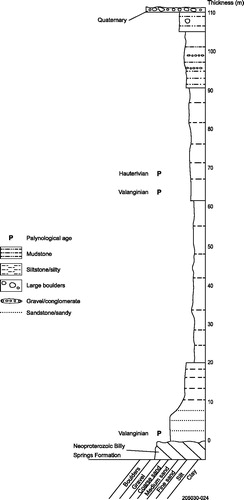
Figure 13. Lithologs for Pelican Well and Village Well sites, showing the stratigraphic position of the Livingston Tillite Member.
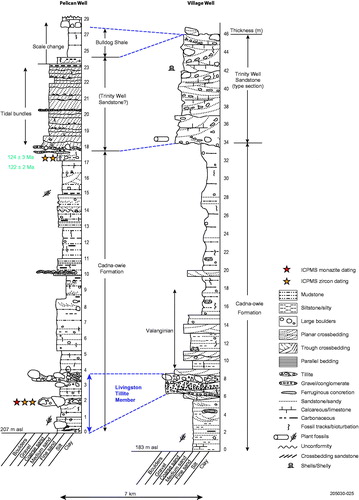
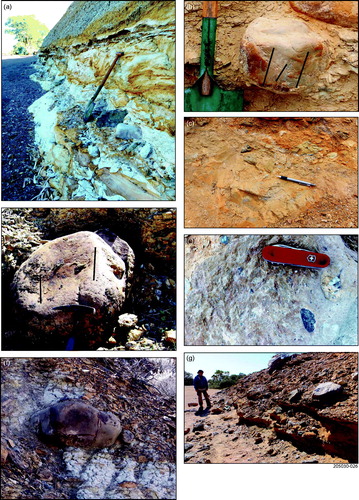
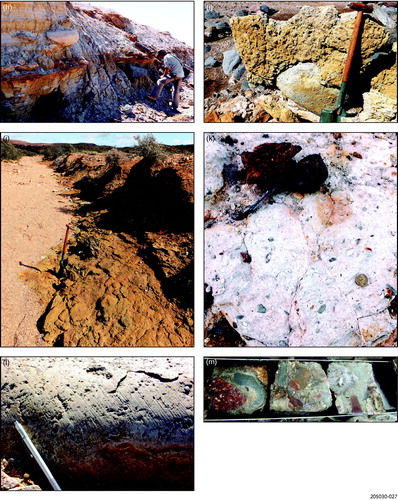
Figure 15. Quartz grain micromorphology at other sites. (a) Grain with multiple conchoidal fractures and grooves containing striae. Direction of grooves shown by arrows. Mt Fitton east site. (b) Conchoidally fractured quartz grain showing slight rounding of fracture edges in upper left half of grain. Grooves and striae on surface within rectangle. Chimney Springs–Petermorra Creek site. (c) Subrounded quartz grain with multiple grooves (arrows), pinhead striae (in rectangle) and striae (S). Billy Springs Creek–Dog Fence site. (d) Broad grooves (arrowed) crossing old conchoidal fracture surface from Hauterivian age diamictite in Cadna-owie Formation, Skeleton 2 drill hole. (e) Fractured grain exhibiting groves in upper left (area arrowed). Livingston Tillite Member in Yalkalpo 1 drill hole.
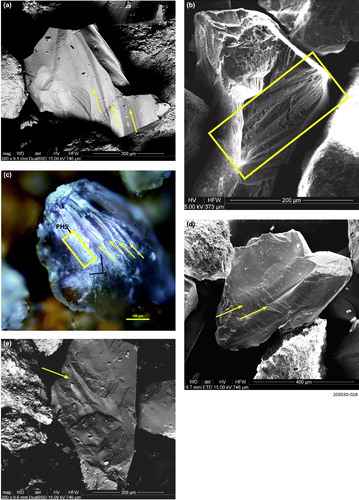
Figure 16. Lithologs for key sites along the northern margin and within the ranges, showing the stratigraphic position of the Livingston Tillite Member.
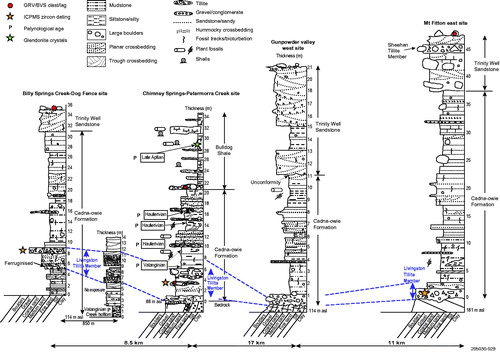
Figure 17. Litholog for the diamictite at the Dead Tree site.
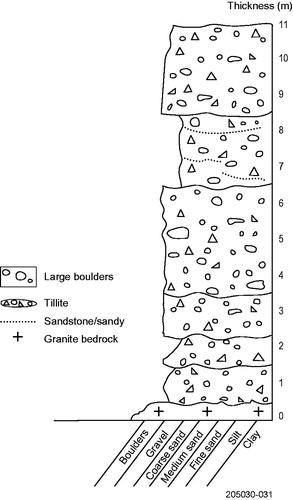
Figure 18. Litholog for Yalkalpo 1 drill hole showing the stratigraphic position of the Livingston Tillite Member and the ages derived by palynological dating.
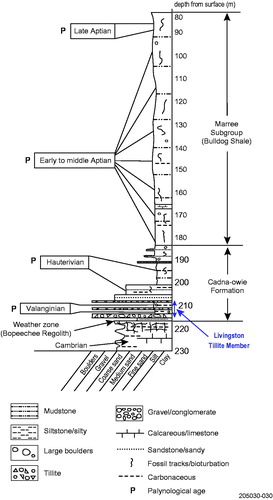
Figure 19. Stratigraphic setting of the Sheehan Tillite Member and its inferred lateral relationship with the Cadna-owie Formation in deeper parts of the Eromanga Basin.
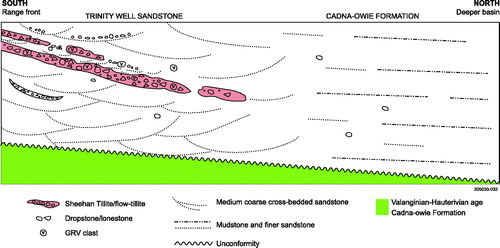
Figure 20. Lithologs for the Sheehan Tillite Member and relationships with the older part of the Cadna-owie Formation and the younger Marree Subgroup. A is the type section, B reference section at Parabarana Hill and C reference section at Gunpowder Bore.
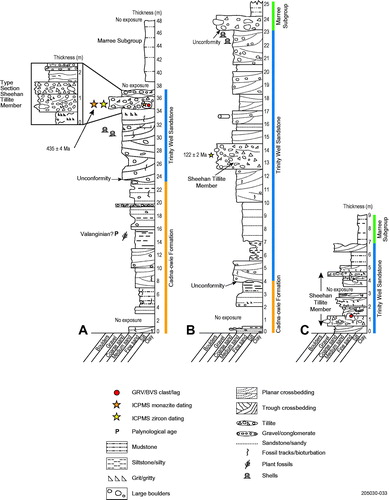
Figure 21. Sheehan Tillite Member at the type section. (a) Large polished and facetted quartzite boulder in the tillite facies at the type section. (b) Large boulder of Terrapinna Granite in the tillite facies, type section.
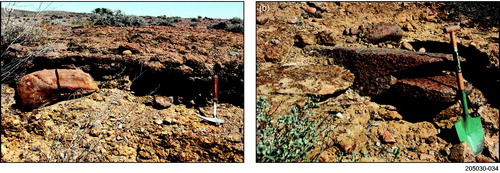
Figure 22. Quartz grain micromorphology at the type section of Sheehan Tillite Member. (a) Grain with multiple conchoidal fractures. (b) Multiple conchoidal fractures along the sharp edge of a quartz grain. (c) Grain showing rounding of conchoidal fractures (central part of grain). (d) Grain showing striae and grooves (direction shown by black arrow). Pinhead striae at point of yellow arrow. (e) Grain with grooves and striae shown within yellow rectangle. (f) Enlargement of (e) showing the grooves and striae cutting across older conchoidal fractures.
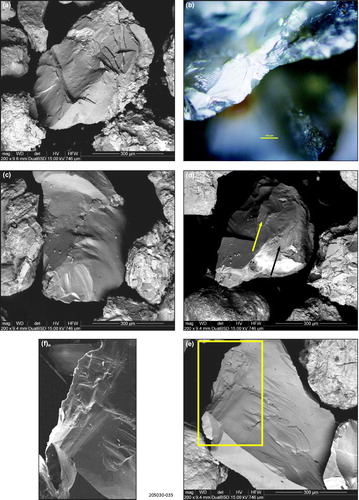
Figure 23. Sheehan Tillite Member, Parabarana Hill reference section. (a) Looking south along the strike of the tillite facies (yellow dashed line) at the Parabarana Hill reference section. (b) Block of tillite facies of the Sheehan Tillite Member. (c) Vertical view of a bedding plane surface with unsorted quartz and quartzite pebbles and boulders (many as dropstones) in coarse sandstone Trinity Well Sandstone, at the 20–21 m level, associated with marine fossils. Large white quartz pebble 9 cm long. (d) Cluster of Lingula subovalis in the upper Trinity Well Sandstone. Twenty cent coin in lower right for scale. (e) Block of Trinity Well Sandstone (in close vicinity to the Lingula fossils) containing impressions of Cyrenopsis? fossils. Part of pocket knife 5 cm in length for scale in lower left. (f) Rhizocorralium burrow in sandstone above the Sheehan Tillite Member facies. (g) Impression of starfish on the surface of a block of Trinity Well Sandstone. Maximum diameter 12 cm.
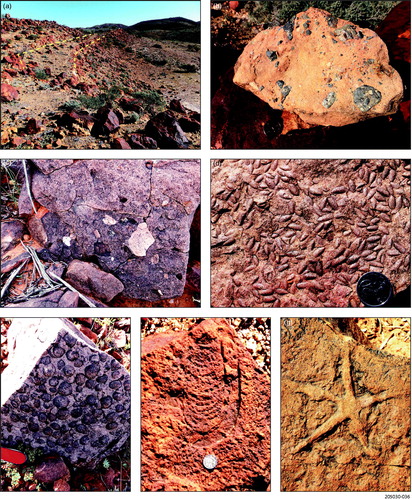
Figure 24. Quartz grain micromorphology for the Sheehan Tillite Member at Parabarana Hill reference section. (a) Conchoidal fractures on edge of rounded grains. (b) Grain with multiple conchoidal fractures. (c) Sharp-edged conchoidally fractured grain exhibiting grooves and striae (arrowed). (d) Conchoidally fractured grain subsequently grooved and striated (arrowed).
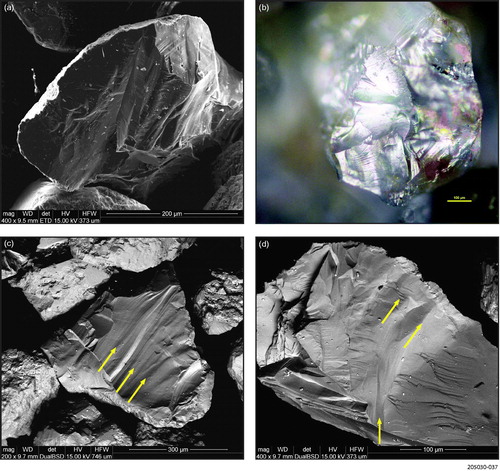
Figure 25. Sheehan Tillite Member at the Gunpowder Bore reference section (a) Large boulders of red porphyry and greenish quartzite in the tillite facies, Gunpowder Bore reference section. (b) Red porphyry boulder in sandy, pebbly tillite facies, Gunpowder Bore reference section. 10 cm ruler to right of boulder. (c) Sandy, pebbly tillite facies, the upper part strongly bioturbated, Gunpowder Bore reference section. 10 cm ruler for scale. (d) Sheehan Tillite Member in the Trinity Well Sandstone, exposed in cliff to the east of Gunpowder Bore. (e) Polished surface on Terrapinna Granite (lower centre and left) surface being exhumed from below the Trinity Well Sandstone outcropping in upper right. Mt Yerila on horizon.
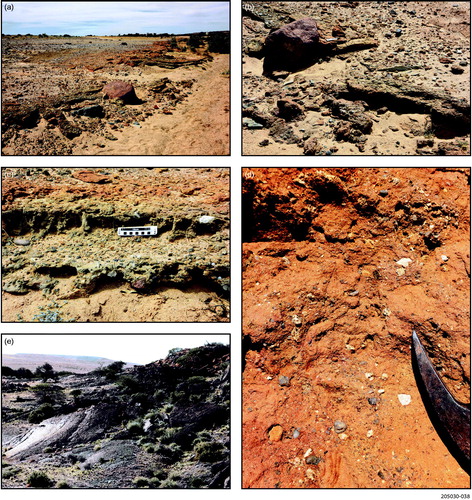
Figure 26. (a) Malcolm Sheard inspecting polished and striated surface developed on Terrapinna Granite west of Gunpowder Bore. (b) Polished Terrapinna Granite at the same site as photo (a) exhibiting striae trending slightly to the right away from the viewer. (c) Polished, grooved and striated surface developed on quartzite, Lagoon Hill, west of Lake Eyre. (d) Closer view of polish, grooving and striae cutting obliquely across the joints in the bedrock.
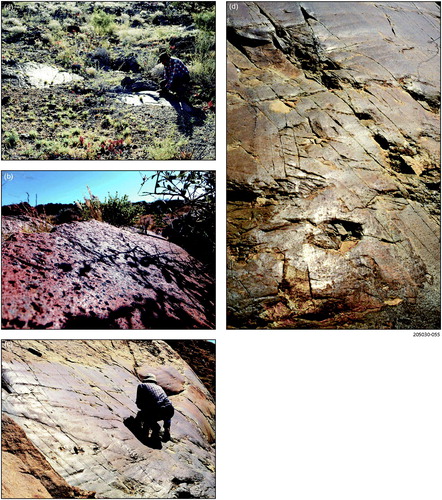
Figure 27. Sheehan Tillite Member characteristics. (a) Tidal bundle facies at Pelican Well site. Spade 75 cm length. (b) Polished, facetted and rounded quartzite boulder exhibiting striae within gritty conglomerate in the upper sandstone (323989E 6692994N). Western Spur in the distance. Two-dollar coin for scale. (c) Tillite lenses in Trinity Well Sandstone at same site as (b). (d) Large polished, facetted and striated boulder in Trinity Well Sandstone at same site as (b) and (c). (e) Clast of Wattleowie Granite in the basal tillite of the sandstone, Western Spur (322802E 6691543N). (f) Boulder of Mt Neil Granite in the upper bouldery Trinity Well Sandstone at Mt Fitton (east) site. (g) Tillite in upper calcareous Trinity Well Sandstone exposed along creek immediately west of Mt Fitton Homestead (abandoned) (loc. ∼360320E 6683460N). (h) Striated quartzite boulder in upper Trinity Well Sandstone at Mt Fitton (east) site.
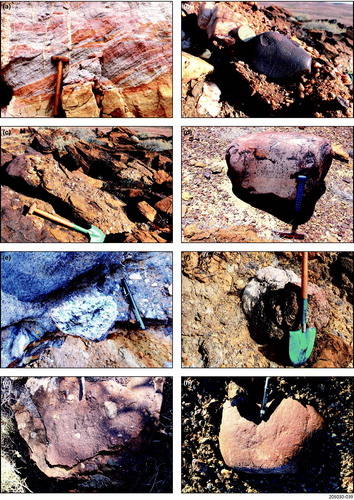
Figure 28. Lithologs for the Mesozoic units south of Paralana hot springs showing Sheehan Tillite Member overlying the Cadna-owie Formation.
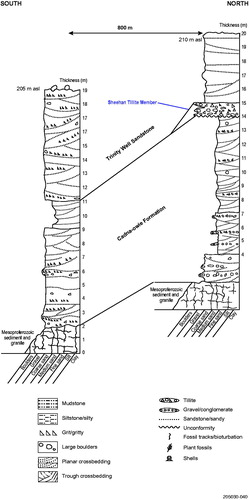
Figure 29. Dropstones and associated diamictite in Bulldog Shale, creek exposure west of Trinity Well. (a) Isolated dropstone (at hammer point) with facetted and polished surface. (b) Line of dropstones in Bulldog Shale. (c) Diamictite containing polished and facetted pebbles associated with large dropstone of dark volcanic rock.
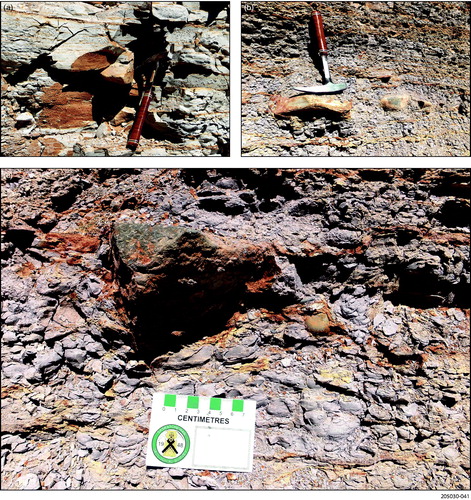
Figure 30. Large dropstones and lonestones. (a) Large facetted and polished quartzite dropstone (∼1.25 m long) in Cadna-owie Formation, Billy Springs Creek–Dog Fence, site. (b) Polished and facetted quartzite dropstone in Bulldog Shale, Petermorra Creek area. Spade head ∼25 cm long.
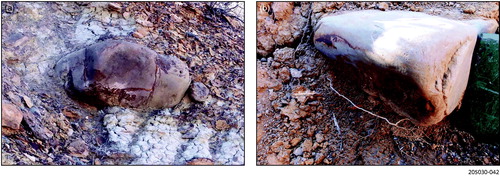
Figure 31. (a) Aptian diamictite at Parabarana Hill site. Pebbly diamictite plastered onto surface of steeply dipping to almost vertical Trinity Well Sandstone. Spade 75 cm in length. (b) Looking along the exposure of diamictite (to right of spade, 75 cm length, and right foreground) with steeply dipping Trinity Well Sandstone (to right of red haversack). (c) Polished, facetted and striated quartzite boulder excavated from diamictite; lines show orientation of striae. (d) Rounded, striated and polished quartzite boulder with lines showing orientation of striae. (e) Polished, facetted and striated boulders and thin diamictite at the base of Bulldog Shale (dark sediment above and to right), overlying reddy brown Cadna-owie Formation, Petermorra Creek area.
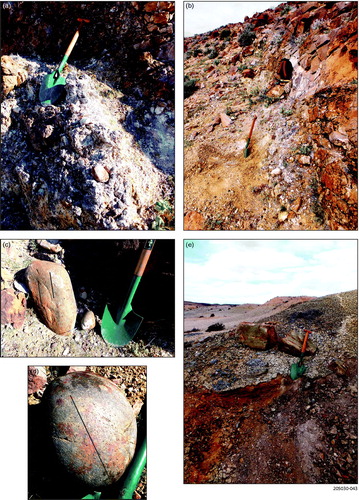
Figure 32. Glendonite crystals in Bulldog Shale, Petermorra Creek. (a) Creek bank exposure of slightly weathered Bulldog Shale, Petermorra Creek. (b) Calcitic glendonite crystal in situ Petermorra Creek in relatively fresh Bulldog Shale. (c) Calcitic and gypsiferous glendonite crystal in situ Petermorra Creek in slightly sandy and weathered Bulldog Shale.
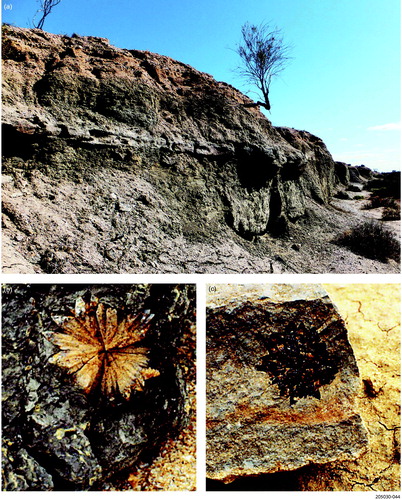
Figure 33. Reconstruction of Livingston Glaciation at its maximum. Proglacial outwash fans and deltas are shown in yellow.
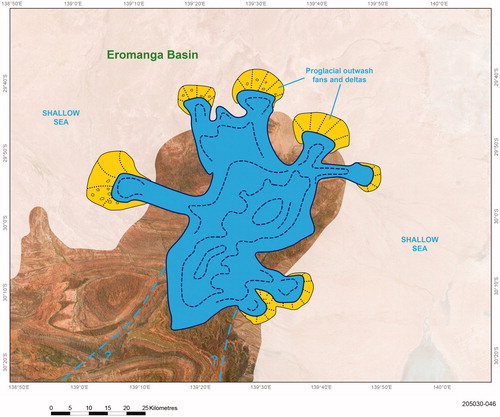
Figure 34. Litholog for the Cadna-owie Formation in Skeleton 2 drill hole showing the presence of Hauterivian age diamictites within core. Ages are shown in red letters: V, Valanginian; H, Hauterivian; and A, Aptian. Detrital zircon dates shown as yellow stars, but only sample 3 produced a date 117 ± 2 Ma relevant to the known ages of the succession.
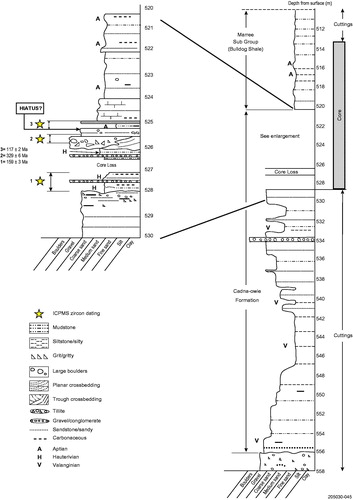
Figure 35. Upper left: interpreted transport directions for distinctive rock lithologies found as clasts in the Livingston Tillite Member. The inset map in the lower right shows potential flow directions for the tillite found in Yalkalpo 1 drill hole. Upper right: interpreted ice cover early in the Livingston Glaciation. Lower-left: interpreted transport directions for distinctive rock lithologies found as clasts in the Sheehan Tillite Member. Lower-right: interpreted ice cover early in the Sheehan Glaciation.
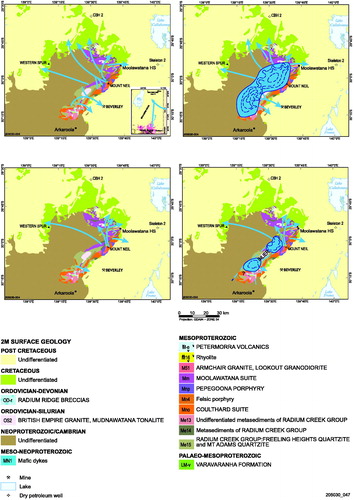
Figure 36. Reconstruction of proposed glacial ice and associated proglacial sediments at the maximum of the Sheehan Glaciation.
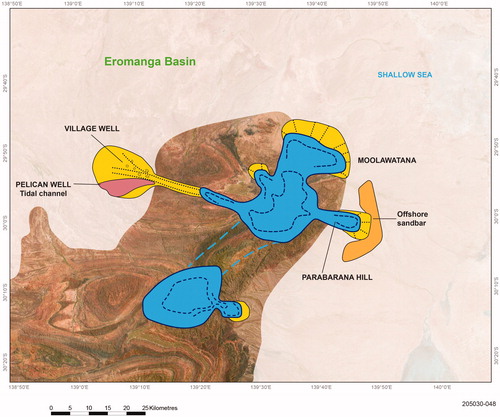
Figure 37. Summary of interpreted glaciations and cold (periglacial?) intervals for the Late Jurassic–Cenomanian interval in the southern Eromanga Basin. Blue arrows represent the range of dropstones and diamictite lenses within the succession.
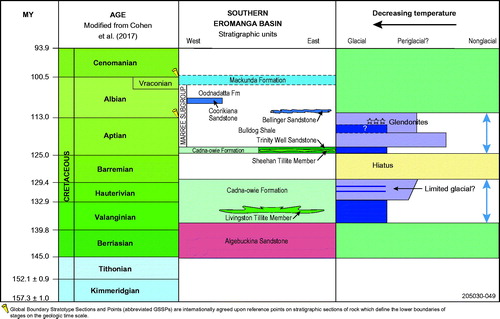
Figure 38. Global cold climate intervals (blue zones) summarised from published information as discussed above.
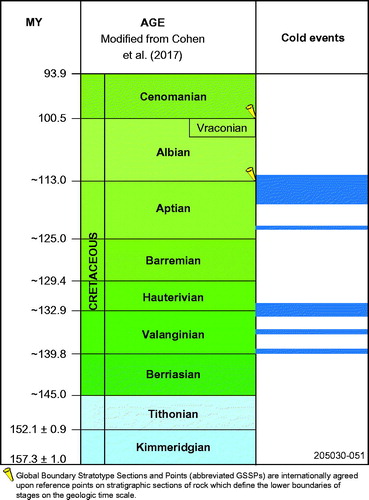
Figure 39. Global cold temperatures set against the stratigraphy of the southern Eromanga Basin. The blue arrows show the stratigraphic distribution of dropstones in the Early Cretaceous strata in the southern Eromanga Basin.
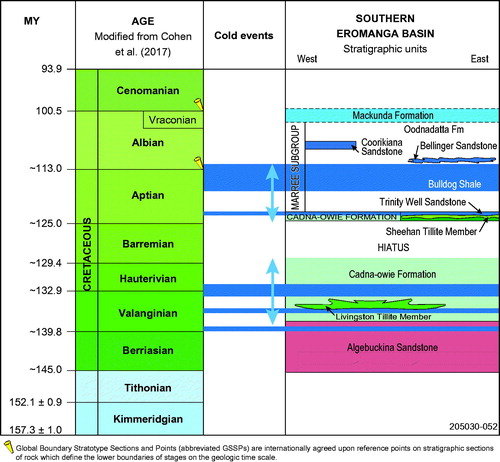
Figure 40. Concept of the ELA separating two glacial regimes. Modified from Isbell et al. (Citation2012).
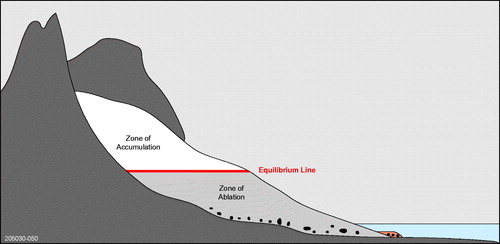
Figure 41. Firn line (ELA) on the Scud Glacier, Coast Mountains, northwestern British Columbia, Canada. (a) Dotted line is the approximate position of the firn line (ELA), up glacier from which there is ice growth and down glacier is ablation. Height of the mountains 2000–2800+ m asl and firn line ∼1100 m asl. Width of the valley at the ELA ∼1.3 km. Considerable thinning of the glacier down valley from the ELA is evident by the fresh moraine exposed along the mountain front on the right of the glacier. Photo taken in late autumn. (b) Vertical view of the ELA showing that it is a broad zone several hundred metres across rather than a distinct line. Ablation below the ELA is exposing medial moraines and crevasses.
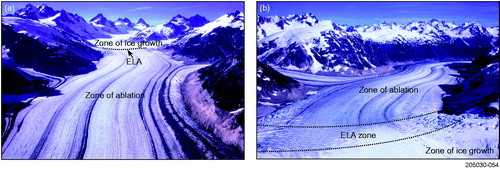
Figure 42. Left: rise in the ELA towards the Equator for the last glacial maximum and the present. Right: global change in the ELA during the last glacial maximum and minimum. Diagrams modified from Isbell et al. (Citation2012).
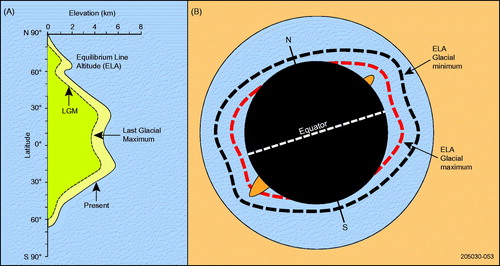
Table 1. List of key outcrop sites and drill holes shown in and referred to in the text.