
Figures & data
Figure 1. (a) Orogens of the Tasmanides, eastern Australia after Glen (Citation2005, Citation2013) and Zhang et al. (Citation2019) with inset of Eastern Gondwana adapted from Boger and Miller (Citation2004). (b) Simplified geological map of the Macquarie Arc (adapted from Glen et al., Citation2011).
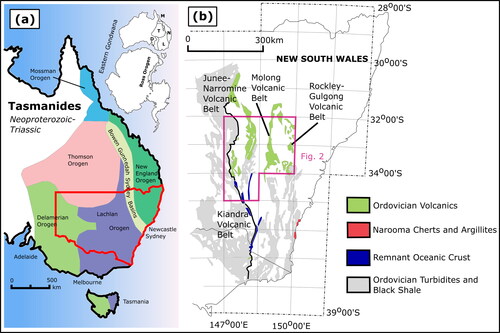
Figure 2. Map showing three northern belts of the Macquarie Arc divided into phases of arc development and with Ordovician turbidites in grey. Based on Percival and Glen (Citation2007) and Glen et al. (Citation2011). The Cowal Igneous Complex (CIC) is indicated by the pink box, which is also the map area for . Inset at lower right shows location of Macquarie Arc volcanic rocks in the Lachlan Orogen, Ordovician turbidites and black shales (craton derived continental margin terranes), and cherts and argillites of the Narooma oceanic plate terrane. Lower-case single letters on the main map are notable localities in the Junee–Narromine Volcanic Belt, m, Marsden Cu–Au porphyry prospect; g, Goonumbla; n, Northparkes alkalic porphyry deposits.
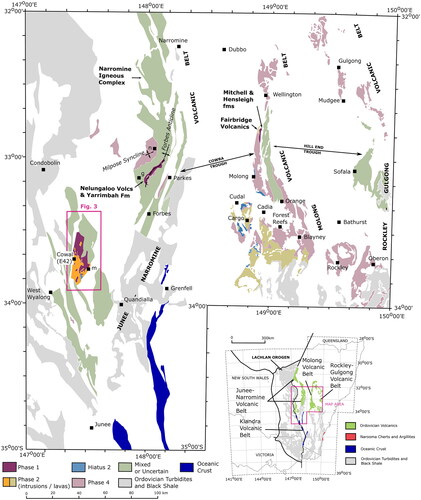
Figure 3. Modified from Radford (Citation2020), Henry et al. (Citation2014) and new graphic logging, facies analysis and 3D modelling () to show internal stratigraphic divisions for the oldest rocks of the Cowal Igneous Complex. Cross-section positions for and are also indicated on the map. The ‘Muddy Lake Diorite’ is in light pink and labelled with ‘MLD’ on the map.
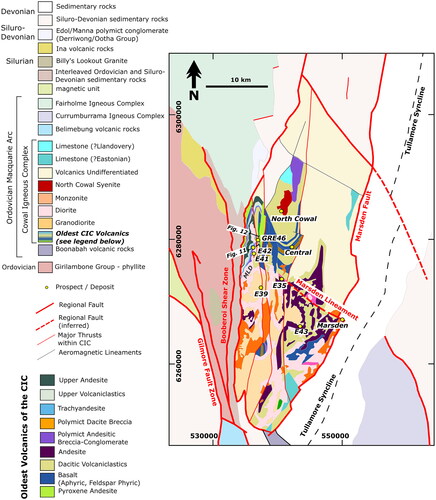
Figure 4. Phases of workflow for establishing scope and preliminary model, carrying out graphic logging and facies analysis, plotting correlation charts and cross-sections and synthesising a 3D Model.
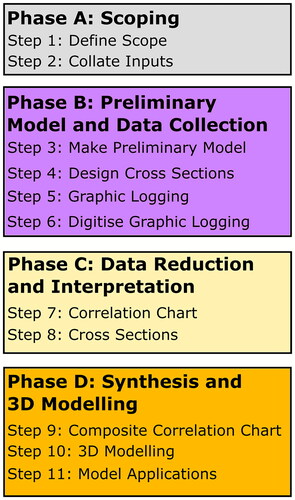
Figure 5. Phase A: Scoping phase of workflow.
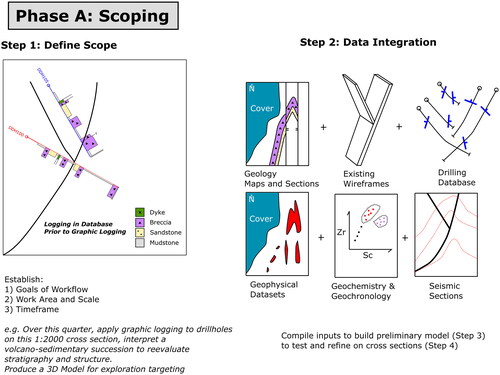
Figure 6. Phase B: Preliminary model and data collection phase of workflow.
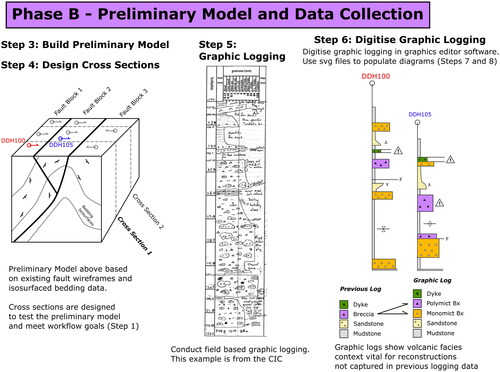
Figure 7. Step 7: Diagram showing the process for building the correlation chart using graphic logging and a graphics editor. Refer to text in ‘step 7’ for descriptions.
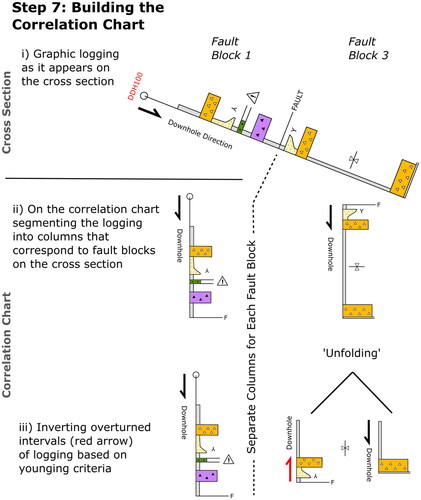
Figure 8. Step 8: Plotting of drill traces and various datasets onto cross-sections (fault wireframes in red, isosurfaced data in blue). The plotted cross-section serves a base layer, and within a graphics editor, the digitised graphic logs are superimposed against the drill traces.
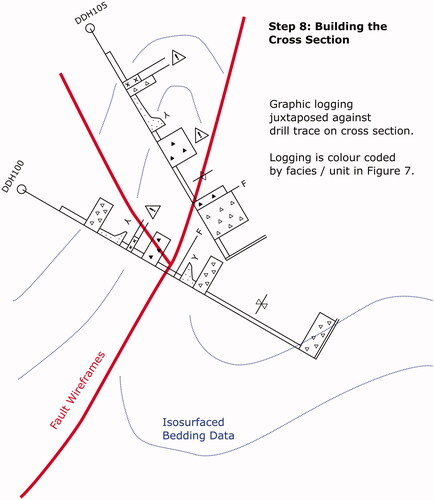
Figure 9. Phase C: Data reduction and interpretation phase of workflow.
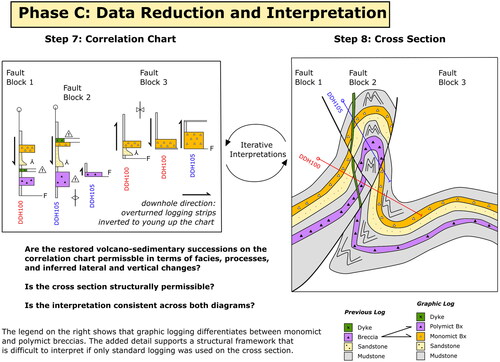
Figure 10. Phase D: Synthesis and 3D modelling phase of workflow.
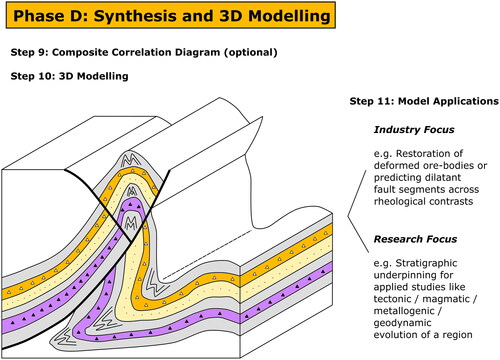
Figure 11. E42-GRE46 cross-section adapted from Barker et al. (Citation2019) showing the geology prior to the CIC facies architecture project. E42 has been well constrained since Miles and Brooker (Citation1998), but correlations with other prospects have been tenuous. Note the undifferentiated coarse and fine volcaniclastics at GRE46 and the lack of inferred facies or stratigraphic links to E42. An example of how this workflow was applied at Cowal is shown in and on the cross-section through the GRE46 deposit ∼1 km to the north (see for cross-section position). GRE46 underground deposit is indicated by dashed red oval. ‘V-clastics’, volcaniclastics.
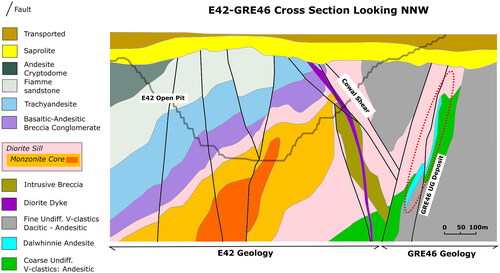
Figure 12. Cowal Igneous Complex (CIC) facies architecture project. A digitised cross-section depicting fault blocks (circled numbers) and a structural-stratigraphic framework. The associated correlation chart is shown in , which also shows the legend for the colours on the cross-section. The position of this cross-section is shown in a map of the CIC in .
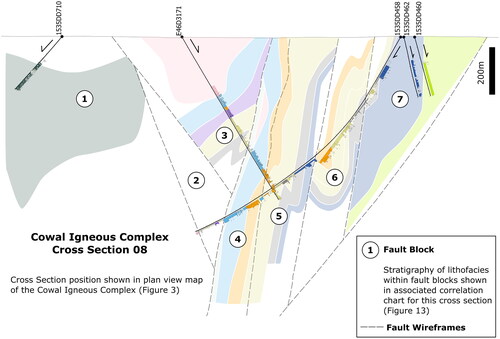
Figure 13. Cowal Igneous Complex (CIC) facies architecture project. This is the correlation chart for the cross-section shown in .
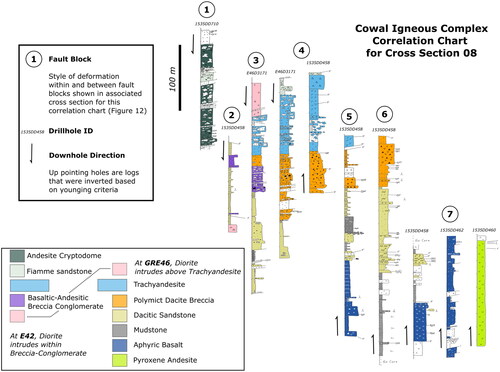
Figure 14. Example of a composite correlation chart taken from the broader PhD project studying the facies architecture of the CIC. This chart was produced in a graphics editor by combining graphic logs from correlation charts from several cross-sections in the CIC. Fault blocks are named in boxes at the top of the chart. Drill-hole names and the ‘source’ cross-section are labelled at the base of the logs. Location of indicated by dashed line rectangle. Locations of the E42 open pit and GRE46 underground mine are indicated by thick red dashed line. The stratigraphic and spatial positions of graphic logs from cross-section 08 (discussed in and ) are indicated by the horizontal red arrows. Lower-case bold letters in circles indicate areas that have been previously documented: (a) Miles and Brooker (Citation1998) originally described the stratigraphy at the E42 open pit, (b) Cannell (Citation2003) extended the upper parts of the E42 stratigraphy adding the ‘Andesite Cryptodome’, (c) Barker et al. (Citation2019) documented correlations between ‘trachyandesite lavas’ from E42 into GRE46, and (d) Decoy was documented as a VMS (Gemmel, Citation2008; Sealey, Citation2012), although no stratigraphic correlations were made to other prospects.
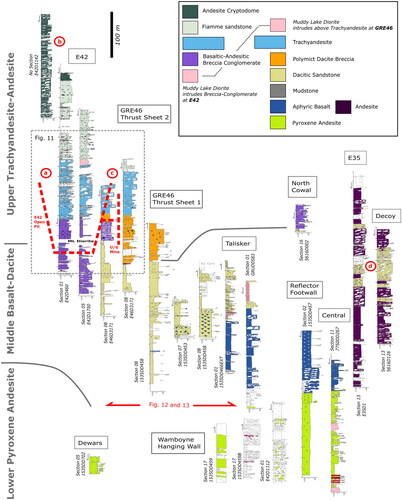
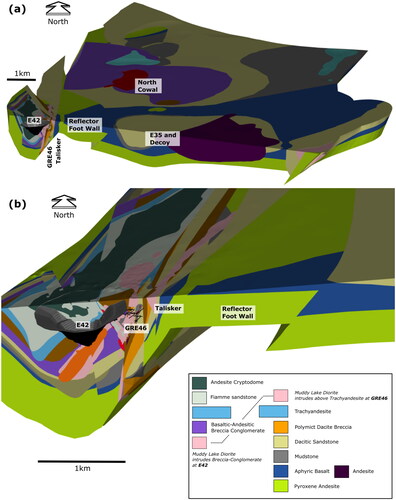
Figure 15. Screenshots of 3D Model in Leapfrog. (a) North-looking view showing the ∼15 km cross-sectional area of the entire CIC. (b) Closer view of ore deposits and adjacent prospects. Selected prospect names are annotated to show locations of the successions shown on the composite correlation chart in .
Supplemental Material
Download MS Excel (20.4 KB)Data availability statement
The data that support the findings of this study are available from Evolution Mining Ltd. Restrictions apply to the availability of these data and are available from MI with the permission of Evolution Mining Ltd. A graphic logging template is given in the supplemental data.