Figures & data
Table 1. Table summarising the key features and proposed mechanisms for TMS and tES.
Figure 1. (A) A TMS coil placed over a targeted brain region, and (B) A tES system.
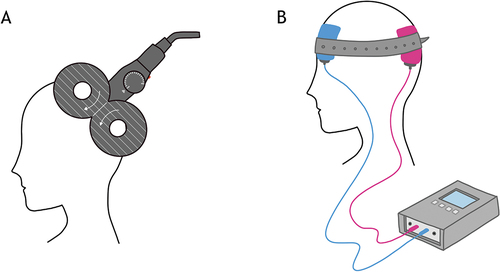
Figure 2. Schematic showing facilitatory and inhibitory TMS and tES protocols. There is no inhibitory tRNS protocol. MSO = maximum stimulator intensity.
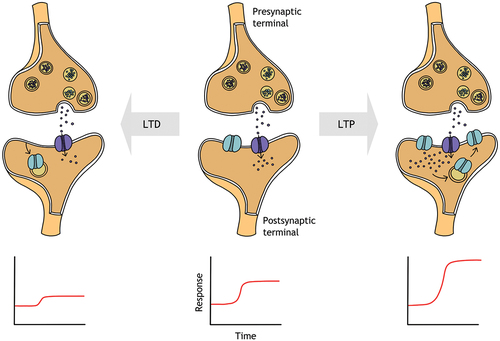
Figure 3. Simplified schematic showing the insertion of a receptor (e.g., NMDA receptor) to the synaptic membrane in response to an increase in intracellular Ca+2, demonstrating long term potentiation (LTP; top right). Removal of a receptor from the membrane is shown for long term depression (LTD; top left), resulting in a decreased postsynaptic response. Long term potentiation and depression mediate the strengthening and weakening of synaptic connections, respectively, resulting in increased and decreased postsynaptic responses (bottom right and left panels).