Figures & data
Table 1. Learning objectives of telehealth curriculum.
Table 2. Telehealth curriculum – telehealth foundations for entry to practice health professional students: a suite of core elements.
Table 3. Technology self-efficacy survey; questions, score, and response distribution. Instructions for participants: The following questions relate to your PERCEPTIONS ABOUT USING TELEHEALTH as part of health professional practice. Please select the most appropriate rating on the scale from Strongly disagree (SD), Somewhat disagree (SWD), Neither agree or disagree (NAD), Somewhat agree (SWA) to Strongly Agree (SA). Note: some questions may be difficult to answer if you haven’t used telehealth or, based on future expectations – that’s ok – do your best to answer them based on how you feel at this time.
Table 4. Telehealth acceptance survey questions, score, and response distribution. Instructions for participants: The following questions relate to your PERCEPTIONS ABOUT USING TELEHEALTH as part of health professional practice. Please select the most appropriate rating on the scale from Strongly disagree (SD), Somewhat disagree (SWD), Neither agree or disagree (NAD), Somewhat agree (SWA) to Strongly Agree (SA). some questions may be difficult to answer if you haven’t used telehealth or, based on future expectations – that’s ok – do your best to answer them based on how you feel at this time.
Figure 1. A: Gender of participants. B: Age of participants.
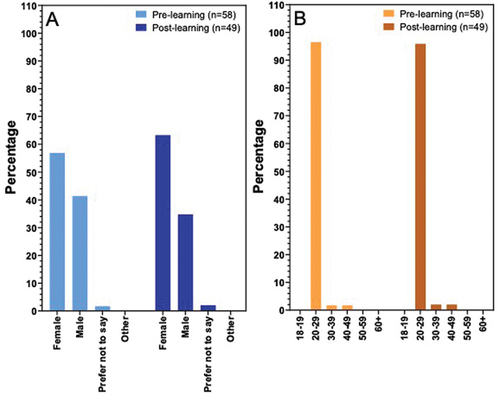
Figure 2. A: Number and percentage of users per device. B: Frequency of online access.
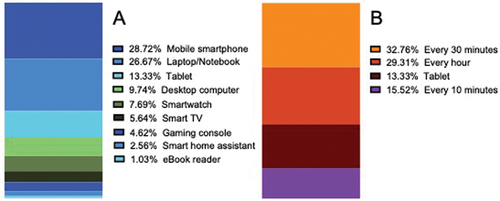
Figure 3. Pre- and post-learning total and domain scores for A: Technology self-efficacy scores, and B: Telehealth acceptance scores.
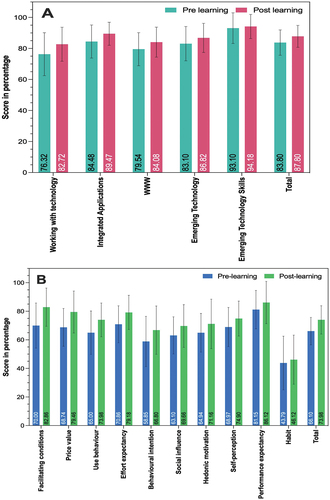
Figure 4. Percentage of participants in each score range pre- and post- learning for A: Technology self-efficacy B: Telehealth acceptance.
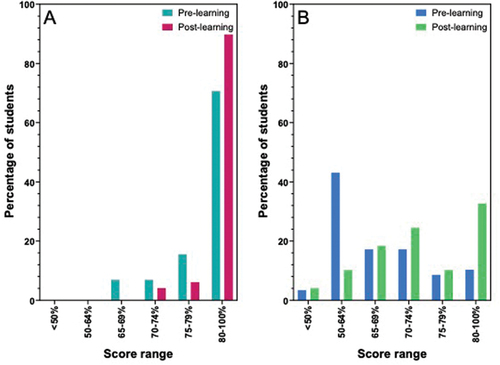
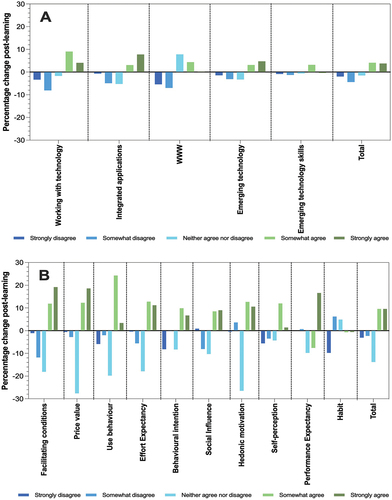
Figure 5. Distribution of change in responses in A: Technology self-efficacy and B: Telehealth acceptance. Percentage change (post-learning score – pre-learning score) for each response category (strongly disagree- strongly agree) for each domain. Values below 0 indicate fewer respondents post-learning and values above 0 indicate more respondents post-learning.