
Figures & data
Figure 1. Specified model of access to entrepreneurial finance.
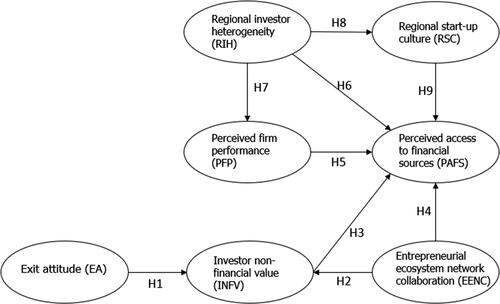
Table 1. Measurements.
Table 2. Self-reported geographic distribution.
Table 3. Inter-item correlations.
Table 4. Inter-construct correlations with the square root of AVE.
Table 5. Construct reliability and AVE.
Table 6. Difference between rural and urban groups.
Figure 2. Common method bias test introducing Common latent factor (CLF).
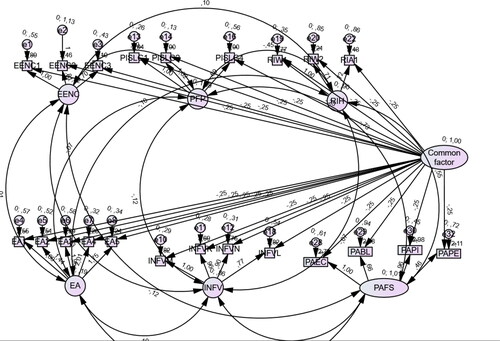
Figure 3. Common method bias test using common marker variable.
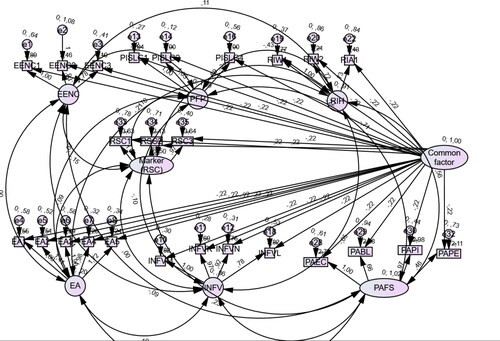
Figure 4. Measurement model with correlations.
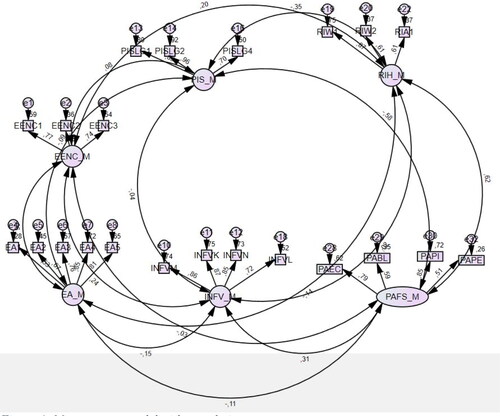
Figure 5. Structural model and path values.
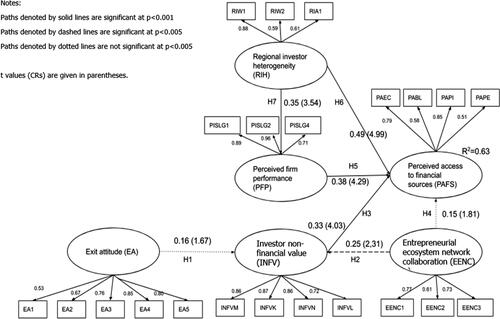
Table 7. Goodness of fit metrics.
Table 8. Hypothesis test results.