Figures & data
Figure 1. Core photographs showing coarse-grained and fine-grained pyrite macro textures. Annotations: pyrite (py), shale (shale), dolomite (Dol), quartz (qz).
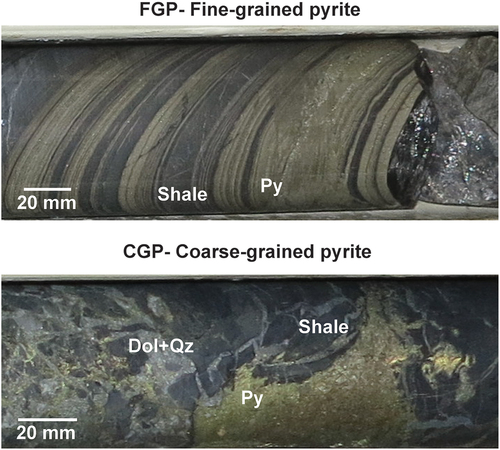
Table 1. Description of selected ore samples.
Table 2. Chemical composition of selected ore samples.
Figure 2. Pyrite (py) texture classes evaluated in this study.
Figure 3. BSE image and mineral map showing the main minerals present in the samples. Sample OD1-FGP. Deleterious groups tetrahedrite, enargite and arsenopyrite.
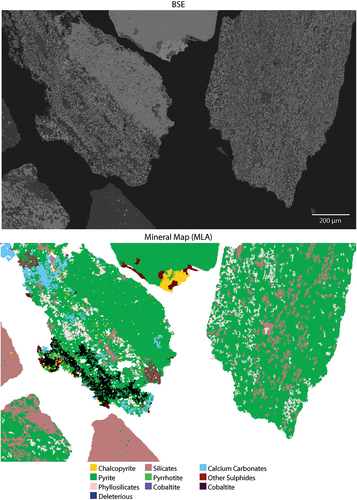
Figure 4. (a) Original BSE Image. (b) Tiled imaged. Yellow shows tiles classified by hand. Pink shows pyrite (Jefferson et al. Citation2023).
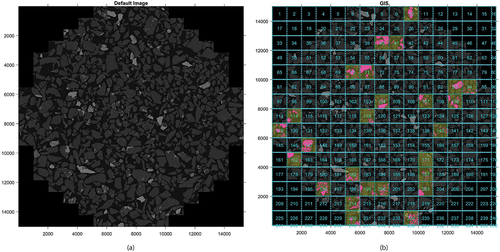
Table 3. Analytical settings for synchrotron X-ray fluorescence microscopy.
Table 4. Flotation test results.
Figure 5. Entrainment and true flotation recoveries of (a) chalcopyrite and (b) pyrite. Adapted from Yenial-Arslan et al. (Citation2023).
Table 5. Pyrite texture prevalence estimates.
Figure 6. XFM results. Ore sample OD2-FGP. Area of interest identified with distinct pyrite textures (10A). Framboidal pyrite textures (10B). Annotations: pyrite (py), chalcopyrite (cpy), dolomite (Dol), quartz (qz).
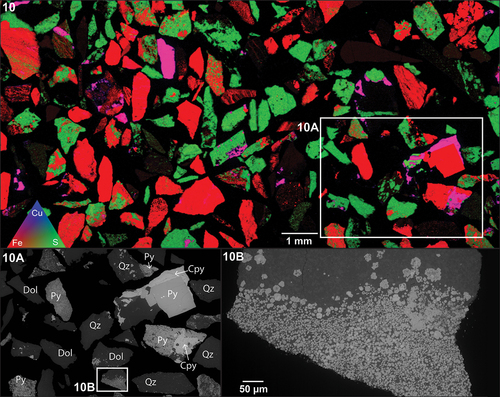
Figure 7. XFM results. Ore sample OD1-FGP. Area of interest identified with distinct pyrite textures (8A). Framboidal pyrite textures (8B). Annotations: pyrite (py), chalcopyrite (cpy), dolomite (Dol), calcite (cal), quartz (qz).
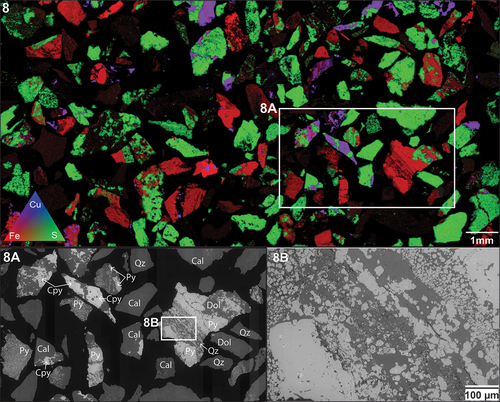
Figure 8. Semi-quantitative XFM element fluorescence maps of ore sample OD2-FGP (10B) showing As, Ca, Cu, Fe, K, Pb, S and Zn concentrations. Minimum concentration shown in dark blue, and maximum concentration in bright yellow.
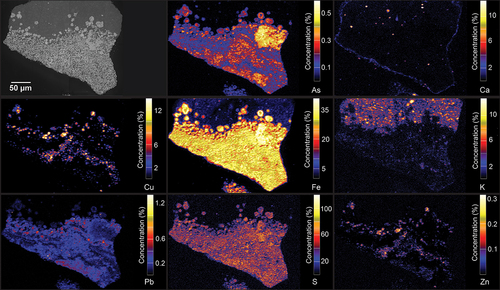
Figure 9. Semi-quantitative XFM element fluorescence maps of ore sample OD1-FGP (8B) showing As, Ca, Cu, Fe, K, Pb, S and Zn concentrations. Minimum concentration shown in dark blue, and maximum concentration in bright yellow.
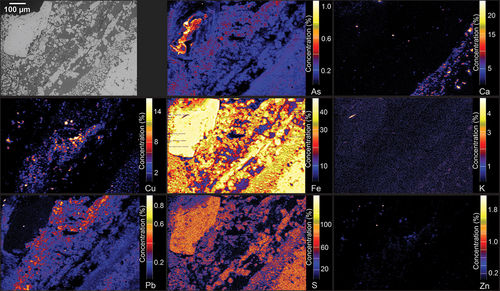
Figure 10. Box and whisker plots of trace elements in pyrite grains by texture class, showing As, Co, Ni, and Cu concentrations in ppm. Framboidal (PyD), fine-grained agglomerated (PyB), coarse-grained (PyA), and fine-grained disseminated pyrite (PyC) are presented in the graph in that order.
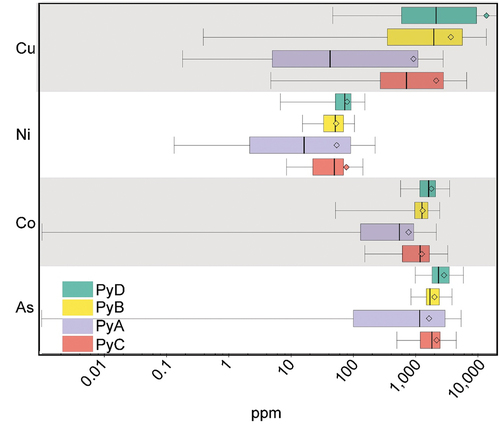
Figure 11. Representative time-resolved depth profiles for fine (PyC) and framboidal (PyD) pyrite grains analyzed in this study, showing Pb, Fe, Cu, Sb, As, Co and Ni intensities.
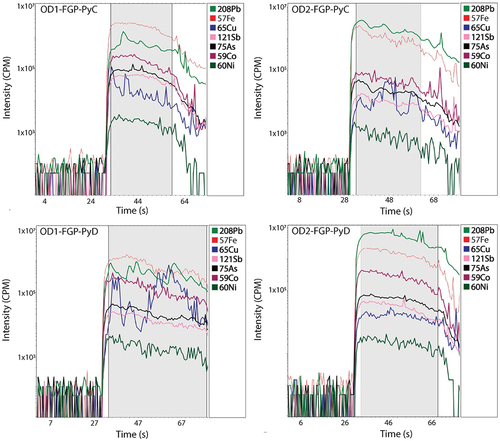
Table 6. Probability analysis of pyrite prevalence and natural floatability of pyrite and chalcopyrite.
Figure 12. Correlation area in pixels of fine-grained pyrite (Py C) vs pyrite recovery.
Figure 13. Correlation area in pixels of framboidal pyrite (py D) vs pyrite recovery.
Figure 14. Correlation prevalence in % of coarse-grained pyrite (Py A) vs pyrite recovery.