Figures & data
Table 1. Overview of digital film studies with relevance to character modeling.
Table 2. Summary of basic statistics for character types in the corpus. NA denotes characters that were not annotated, but who had at least 10 utterances.
Table 3. Performance of the linguistic marker classifiers: number of classes; F1 scores along with the standard deviation for the average weighted, and majority and minority class.
Figure 1. Illustration of closeness centrality for the screenplay of The Matrix in the semantic dialog graph weighted by the address marker, i.e., larger circles indicate higher closeness centrality values. The plot indicates that the mentor character Morpheus can address characters better than other characters in the plot.
Figure 2. Illustration of betweenness centrality for the screenplay of Gladiator in the semantic dialog graph weighted by the address marker. Betweenness centrality in an address marker weighted graph is a measure of control over addressing messages passed between characters. For the screenplay of Gladiator, the character with the strongest betweenness centrality is the hero Maximus, indicating that this character has a central role.
Figure 3. Illustration of the clustering coefficient for the screenplay of Mission Impossible in the undirected semantic dialog graph weighted by the normalized frequency of received interjection markers. As shown, the clustering coefficient can be understood as feature for side roles.
Table 4. Macro-average F1 scores for character type prediction. Best results for each character type are typed with bold font.
Table 5. Dialog characteristics of side characters Norm and Max as compared to total of annotated utterances.
Figure 4. Selected linguistic and graph features per character type (listener, speaker) using dependence between variables and class label: Address; dialog act classes: Dcommand, Dother, Dstatement, Dwh question, Dyn question; Discontinuities; Ellipsis; Interjection; Nonstandard English lexicon; Person; Polarity; Sentiment neutral. The degree of dependence is stated numerically and reflected in the gray levels of cells. Blank cells indicate that the feature has not been selected.
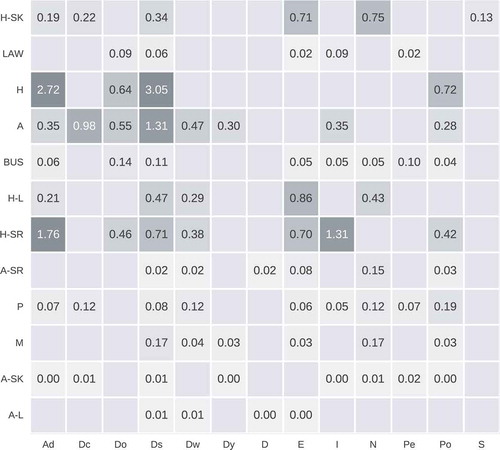
Figure 5. Structural differences in the plot Avatar based on differences obtained from histogram representations of manually adjusted scene boundaries. The computed differences represent the change of character interaction compared to the previous scene. Automatically extracted plot points (peaks in the interaction profile) are shown as red dots. The plot points assumed on the basis of the common three-act structure are indicated by orange bars.
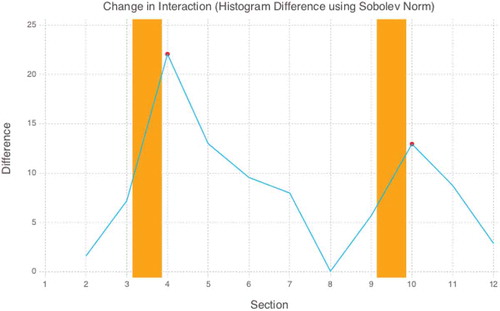
Figure 6. Histogram representations of manually adjusted scenes of the screenplay of Avatar. For better visual inspection, frequencies are colored in log space.
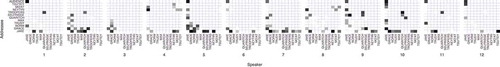
Figure 7. Percentage of commands and command-like utterances by protagonist (Jake) and antagonist (Quaritch) in Avatar over time.