
Figures & data
Figure 1. Overview of selection of empirical research.
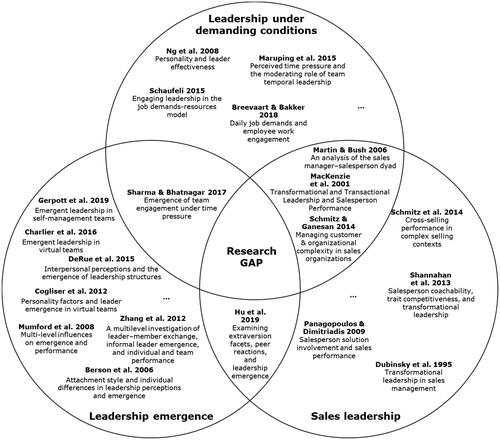
Table 1. Selected studies on leadership emergence.
Figure 2. Moderator selection framework & conceptual framework.
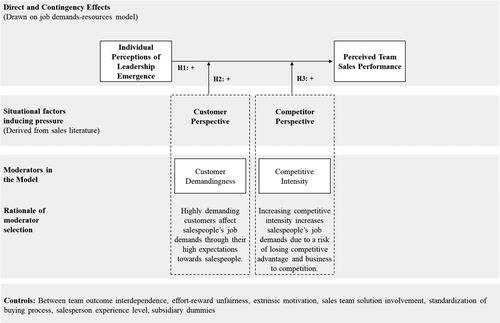
Table 2. Descriptive statistics and correlations.
Table 3. Model hypotheses and results.
Figure 3. Interaction plots.
*p < .10, **p < .05, ***p < .01, n.s. not significant (p > .10) (two-tailed).
Notes: We report unstandardized coefficients. High/low moderator values reflect +/- 1.0 standard deviations from the mean value.
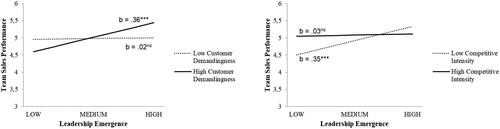
Table 4. Interviews with salespeople on CI moderation.
Supplemental material