
Figures & data
Figure 1. Effects of erythropoietin on renal function after cyclosporin A induction. (A) The mean level of SCr in each group. (B) The mean level of Cr clearance in each group. (C) The mean level of BUN in each group. (D) The mean level of BUN clearance in each group. (E) The HE staining of renal section of each group (200×). (F) The Masson’s trichrome staining of renal section of each group (400×). (G) Proprotion of renal fibrosis area. Data are presented as the means ± standard error of the mean for six independent experiments. *p < 0.05 versus the control group; ▲p < 0.05 versus the Cs A group; #p < 0.05 versus the Cs A + EPO group.
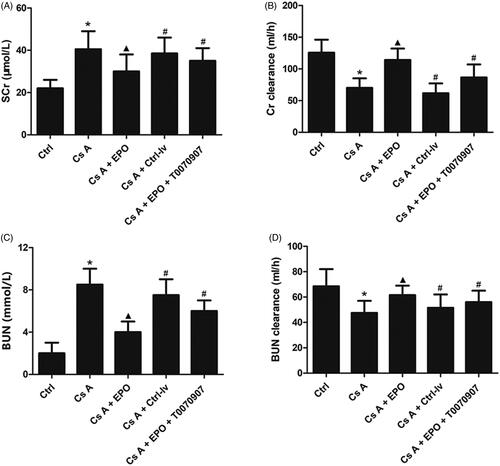
Figure 2. Effects of erythropoietin on renal injury after cyclosporin A induction. (A) The HE staining of renal section of each group (200×). (B) The Masson’s trichrome staining of renal section of each group (400×). (C) Renal injury scores. (G) Proprotion of renal fibrosis area. Data are presented as the means ± standard error of the mean for six independent experiments. *p < 0.05 versus the control group; ▲p < 0.05 versus the Cs A group; #p < 0.05 versus the Cs A + EPO group.
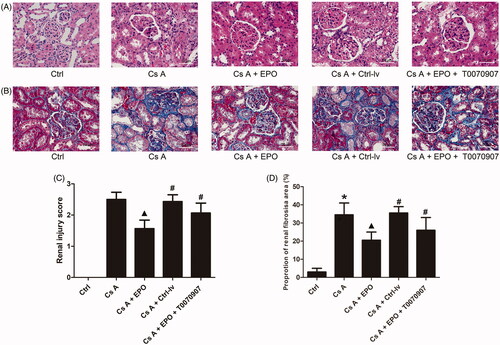
Figure 3. Effects of erythropoietin on releases of IL-6, IL-1β, and TGF-β1. (A) The concentration of IL 6 in serum of each group. (B) The concentration of IL-1β in serum of each group. (C) The concentration of TGF-β1 in serum of each group. Data are presented as the means ± standard error of the mean for six independent experiments. *p < 0.05 versus the control group; ▲p < 0.05 versus the Cs A group; #p < 0.05 versus the Cs A + EPO group.
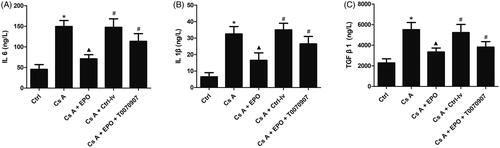
Figure 4. Effect of erythropoietin on oxidative stress reaction in concanavalin A-induced renal injury. (A) The concentration of MDA in kidney of each group. (B) The concentration of SOD in kidney of each group. Data are presented as the means ± standard error of the mean for six independent experiments. *p < 0.05 versus the control group; ▲p < 0.05 versus the Cs A group; #p < 0.05 versus the Cs A + EPO group.
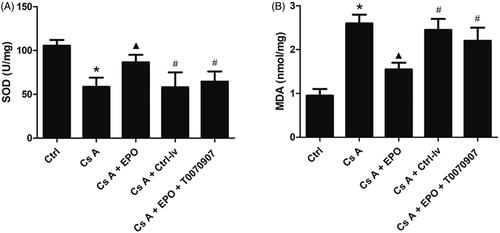
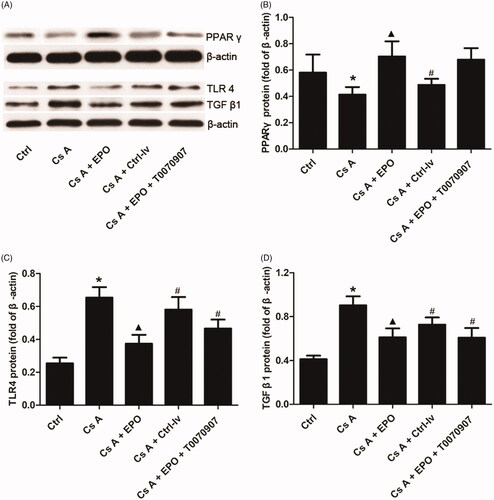
Figure 5. Effects of erythropoietin on protein expression levels of PPAR γ, TLR4, and TGF-β1 in concanavalin A-induced renal injury. (A) The bands of PPAR γ, TLR4, and TGF-β1 in each group. (B) The relative band intensity of PPARγ in each group. (C) The relative band intensity of TLR4 in each group. (D) The relative band intensity of TGF-β1 in each group. Data are presented as the means ± standard error of the mean for six independent experiments. *p < 0.05 versus the control group; ▲p < 0.05 versus the Cs A group; #p < 0.05 versus the Cs A + EPO group.
Data availability
The scientific and statistical data used to support the findings of this study are included within the article.