
Figures & data
Table 1. Characteristics of the Study Population (N = 355).
Table 2. GDF15 level in all patients and subgroups.
Figure 1. Correlation between GDF15 and eGFR and urine protein-to-creatinine ratio (n = 355) (A) GDF15 is significantly correlated with eGFR. (B) GDF15 is negatively significantly correlated with uPCR. Data are displayed as scatterplots. Abbreviations: eGFR estimated glomerular filtration rate, PCR protein-to-creatinine ratio. uPCR was logarithm transformed in correlation analysis.
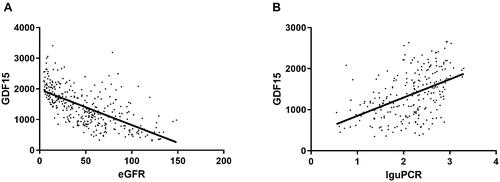
Table 3. Association between GDF15 and cardiovascular evaluation results.
Table 4. Associations between cardiovascular evaluation results and GDF15.