Figures & data
Table 1. Characteristics of patients according to BMI groups and admission diagnosis.
Table 2. AKI stages, interventions, and treatments during the ICU stay.
Table 3. The average of ICU scores, mechanical ventilator values, and blood parameters of the patients during ICU follow-up.
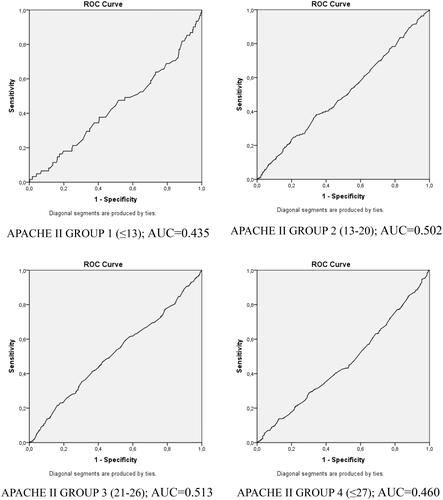
Figure 1. ROC analysis curves of BMI and AKI according to four different APACHE groups.
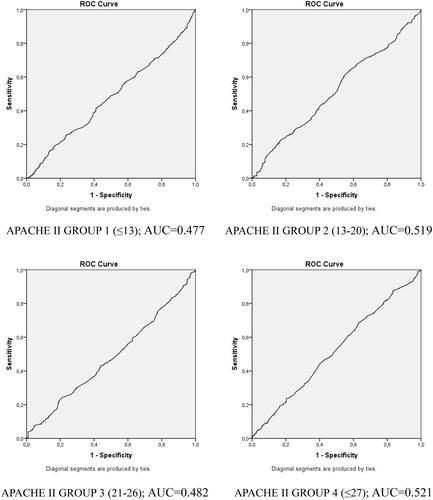
Table 4. Logistic regression of the risk of AKI development according to the BMI.
Table 5. AKI development according to the diagnosis of admission to the ICU and mortality rates to BMI groups.
Figure 2. ROC analysis curves of BMI and mortality according to four different APACHE groups.