1,347
Views
2
CrossRef citations to date
0
Altmetric
Clinical Study

Dominant factors of the phosphorus regulatory network differ under various dietary phosphate loads in healthy individuals

, , , , , , & show all
Pages 1076-1086 | Received 10 Dec 2020, Accepted 15 Jun 2021, Published online: 30 Jun 2021

Figures & data

Table 1. Baseline characteristics of six healthy participants.

Figure 1. Time courses of changes in the levels of mineral metabolism-related variables after each diet intervention.

Changes in serum phosphate (A), urinary Pi/Cr (B), serum calcium (C), FGF23 (D), PTH (E), α-Klotho (F), 1,25(OH)2D3 (G) and BALP (H) levels in six healthy participants at 9 times points during the last 24 hours of a regular phosphorus diet, low-phosphorus diet, and high-phosphorus diet intervention. Urinary Pi/Cr: urinary phosphorus/creatinine rate; FGF23: fibroblast growth factor 23; PTH: parathyroid hormone; 1,25(OH)2D3: 1,25-dihydroxyvitamin D3; BALP: bone alkaline phosphatase.

Figure 1. Time courses of changes in the levels of mineral metabolism-related variables after each diet intervention.Changes in serum phosphate (A), urinary Pi/Cr (B), serum calcium (C), FGF23 (D), PTH (E), α-Klotho (F), 1,25(OH)2D3 (G) and BALP (H) levels in six healthy participants at 9 times points during the last 24 hours of a regular phosphorus diet, low-phosphorus diet, and high-phosphorus diet intervention. Urinary Pi/Cr: urinary phosphorus/creatinine rate; FGF23: fibroblast growth factor 23; PTH: parathyroid hormone; 1,25(OH)2D3: 1,25-dihydroxyvitamin D3; BALP: bone alkaline phosphatase.

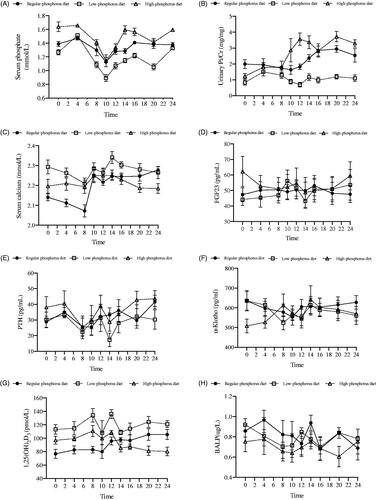
Table 2. Repeated measures correlation analysis of each mineral metabolic variable following different types of phosphorus diets.

Figure 2. The network of phosphorus metabolism according to Granger causality analysis following regular, low-, and high-phosphorus diet interventions.

Causality graph with the betweenness centrality index (A1, B1 and C1), the weighted adjacency matrices (A2, B2 and C2) and the highest betweenness and degree effects (A3, B3 and C3) following regular, low- and high-phosphorus diet interventions. The shading, from light green for the lowest value to dark green for the highest value, represents the values of the variables (betweenness in the nodes of graphs A1 and A3, weighted adjacency in matrix A2). The shading scale is to the right of each panel. Graph A3 is the simplified version of graph A1, in which the phosphatonin with the highest betweenness value is placed in the middle, and the thin arrows show the regulatory relationships associated with this phosphatonin. In addition, the large orange and green arrows indicate the variables with the highest outdegree and indegree values. Abbreviations: U-Pi/Cr, urinary phosphorus/creatinine rate; PTH, parathyroid hormone; FGF23, fibroblast growth factor 23; BALP, bone alkaline phosphatase; 1,25D, 1,25-dihydroxyvitamin D3; S-Pi, serum phosphate; S-Ca, serum corrected calcium.

Figure 2. The network of phosphorus metabolism according to Granger causality analysis following regular, low-, and high-phosphorus diet interventions.Causality graph with the betweenness centrality index (A1, B1 and C1), the weighted adjacency matrices (A2, B2 and C2) and the highest betweenness and degree effects (A3, B3 and C3) following regular, low- and high-phosphorus diet interventions. The shading, from light green for the lowest value to dark green for the highest value, represents the values of the variables (betweenness in the nodes of graphs A1 and A3, weighted adjacency in matrix A2). The shading scale is to the right of each panel. Graph A3 is the simplified version of graph A1, in which the phosphatonin with the highest betweenness value is placed in the middle, and the thin arrows show the regulatory relationships associated with this phosphatonin. In addition, the large orange and green arrows indicate the variables with the highest outdegree and indegree values. Abbreviations: U-Pi/Cr, urinary phosphorus/creatinine rate; PTH, parathyroid hormone; FGF23, fibroblast growth factor 23; BALP, bone alkaline phosphatase; 1,25D, 1,25-dihydroxyvitamin D3; S-Pi, serum phosphate; S-Ca, serum corrected calcium.

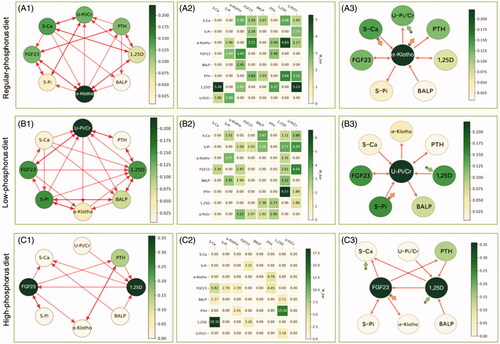
Table 3. Graph theory and network analysis of the interactions among variables in phosphorus regulatory network following different dietary interventions.

Supplemental material

Supplemental Material

Download PDF (202 KB)

Supplemental Material

Download PDF (581.8 KB)