
Figures & data
Figure 1. Identification and validation of macrophage polarization in chronic allograft fibrosis. (A) volcano plot of differentiated expressed genes (DGEs) in GSE25902; (B-C) Gene set enrichment analysis of DEGs in GSE25902 in GO (B) and KEGG (C) databases; (D) immune cell infiltration results of DEGs using Cibersort software. The red bars represent the relative abundance of specific immune cells in the CAD group, and the blue bars represent the relative abundance of corresponding immune cells in the stable group; (E) HE and Masson staining results in renal specimens from healthy volunteers (n = 5) and patients with chronic allograft dysfunction (CAD; n = 5); (F-G) Indirect double immunofluorescence staining of CD68(+) iNOS(+) M1 macrophages (F) and CD68(+) CD206(+) M2 macrophages (G) in Normal (n = 5) and CAD (n = 5) groups; (H-L) PCR analysis of CD68 mRNA (H), iNOS mRNA (I), CD86 mRNA (J), Arg-1 mRNA (K), and Fizz1 mRNA (L) in Normal (n = 5) and CAD (n = 5) groups. **p < 0.01 compared to Normal group; ***p < 0.001 compared to Normal group; ****p < 0.0001 compared to Normal group. Each experiment was duplicated at least thrice.
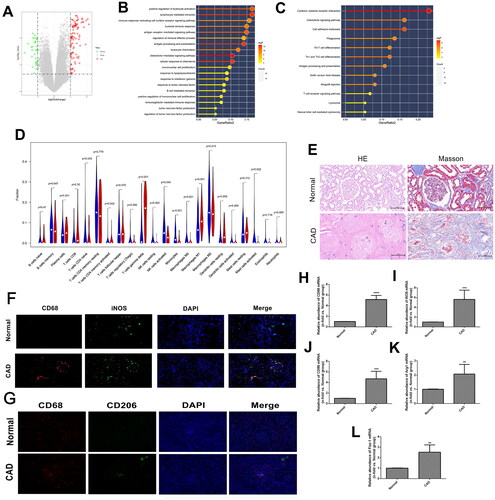
Figure 2. Effects of M1 and M2 macrophages on endothelial cells in vitro. (A) Western Blot (WB) results of α-SMA and VE-Cadherin proteins in MAECs treated with M1 macrophages for 0, 24, and 48 h; (B) quantitative analysis of WB results; (C-D) PCR analysis of α-SMA mRNA (C), and VE-Cadherin mRNA (D); (E) WB results of α-SMA and VE-Cadherin proteins in MAECs treated with M2 macrophages for 0, 24 and 48 h; (F) quantitative analysis of WB results; (G-H) PCR analysis of α-SMA mRNA (G), and VE-Cadherin mRNA (H). *p < 0.05 compared to 0h group; ***p < 0.001 compared to 0h group; ****p < 0.0001 compared to 0h group; NS, no significance compared to 0h group. Each experiment was duplicated at least thrice.
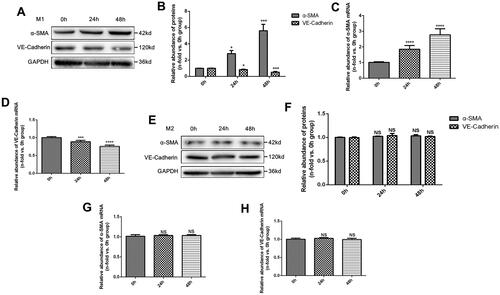
Figure 3. Functional examination of MAECs treated with macrophages. (A) Indirect immunofluorescence staining of VE-Cadherin in MAECs treated with M1 and M2 macrophages; (B) relative abundance of VE-Cadherin immunofluorescence staining among three groups (****p < 0.0001 compared to ECs group; NS, no significance compared to ECs group; #p < 0.0001 compared among three groups); (C) Transwell assays of MAECs treated with M1 and M2 macrophages; (D) Migration index of MAECs in two groups (****p < 0.0001 compared to M1 + ECs group); (E-F) concentrations of Fibronectin (E) and Collagen-I (F) in the supernatant of MAECs treated with M1 and M2 macrophages (**p < 0.01 compared to 0h group; ****p < 0.0001 compared to 0h group; NS, no significance compared to 0h group). Each experiment was duplicated at least thrice.
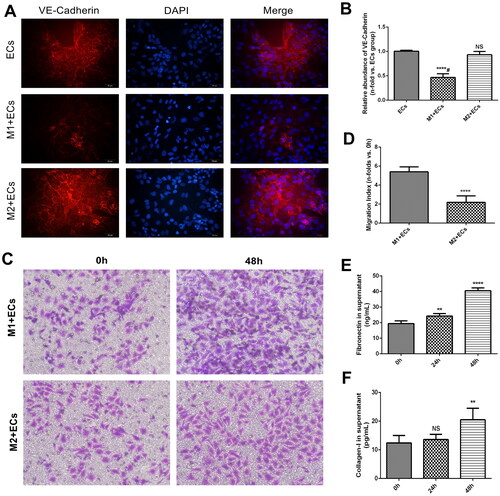
Figure 4. RNA sequencing and data analysis of M1 macrophages. (A) Volcano plot of differentiated expressed genes (DGEs) between M1 and M0 macrophages; (B) Gene set enrichment analysis of DEGs in KEGG databases; (C) data on TNF signaling pathway graph in KEGG databases; (D-E) gene set enrichment analysis of DEGs in GSE25902 in GO databases.
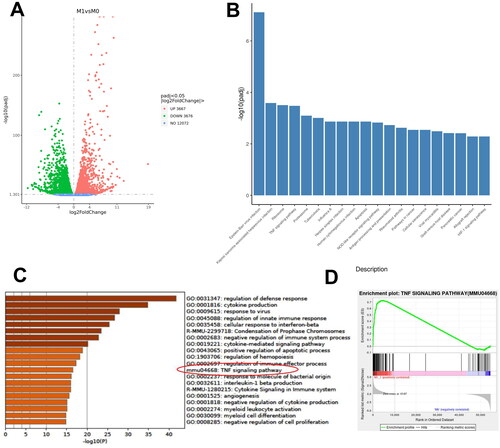
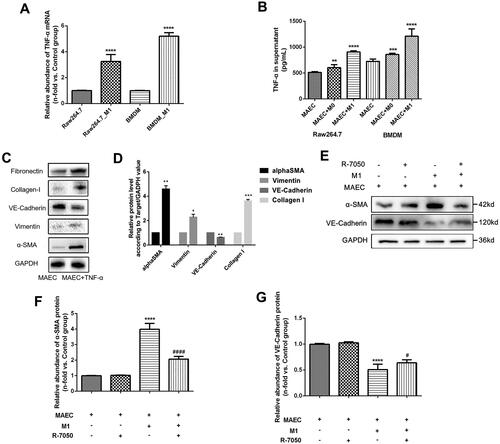
Figure 5. TNF signaling pathway examination in MAECs cells treated with M1 macrophages. (A) Relative abundance of TNF-α mRNA in M1 macrophages by PCR; (B) TNF-α cytokines in the supernatant of MAECs treated with M1 macrophages; (C) WB results of α-SMA, Vimentin, and VE-Cadherin proteins in MAECs treated with TNF-α cytokines; (D) quantitative analysis of WB results; (E) WB results of α-SMA and VE-Cadherin proteins in MAECs treated with M1 macrophages and/or R-7050; (F-G) quantitative analysis of WB results of α-SMA (F) and VE-Cadherin (G) proteins. *p < 0.05 compared to control group; **p < 0.01 compared to control group; ***p < 0.001 compared to control group; ****p < 0.0001 compared to control group; #p < 0.05 compared to intervention group with M1 and MAEC; ####p < 0.0001 compared to intervention group with M1 and MAEC. Each experiment was duplicated at least thrice.
Supplemental Material
Download PNG Image (42.1 KB)
Data availability statement
The data supporting this study’s findings can be obtained from the corresponding author upon reasonable request.