
Figures & data
Figure 1. Indicators change over 12 week in rats. (A)Weight, (B) liver and kidney index. (C) Urine indicators(mg/dl). (D) Microvillus length(nm).
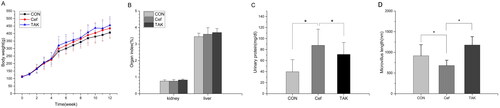
Figure 2. OUT Division of fecal sample microecology. (A)Venn diagram, (B) Rarefaction curves, (C) Species accumulation curves, (D) Rank-abundance distribution curves.
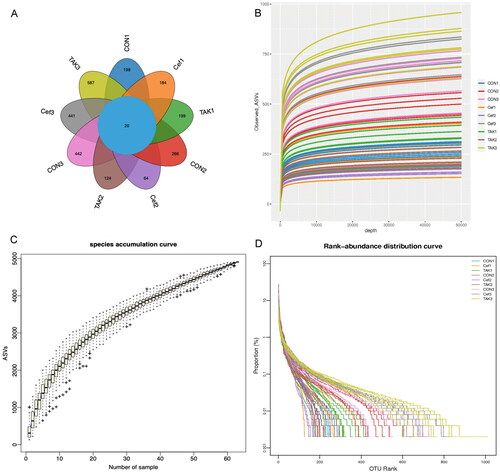
Figure 3. Alpha-diversity analysis and beta diversity of the fecal sample. (A) Chao 1, (B) ACE, (C) Shannon, (D) Simpson (E) PCoA analysis.
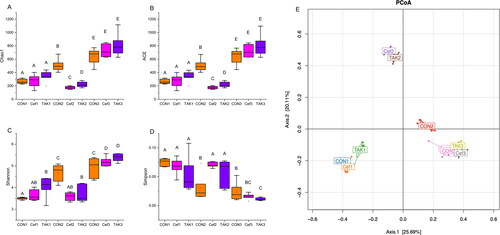
Figure 4. Analysis the characteristic of the flora at the phylum and genus level. (A) The structure and relative abundance of the flora at the phylum, (B) Firmicutes/Bacteroidetes (F/B) ratio, (C) relative abundance of Tenericutes at the time of week 12, (D) LEfSe analysis.
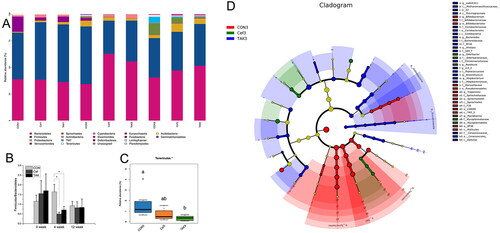
Figure 5. Prediction of metabolic function of intestinal flora. (A) Prediction second level distribution diagram of KEGG by PICRUSt2, (B) Predicted functional comparison between CON group and Cef group at week 12, (C) Predicted functional comparison between TAK group and Cef group at week 12.
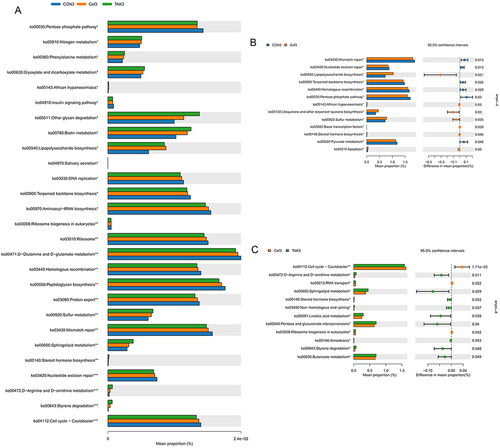
Figure 6. Intestinal mucosal morphological changes. (A-C)colon section of the CON, Cef, and TAK at low magnification, (D-F) Colon section of the CON, Cef, and TAK at high magnification.
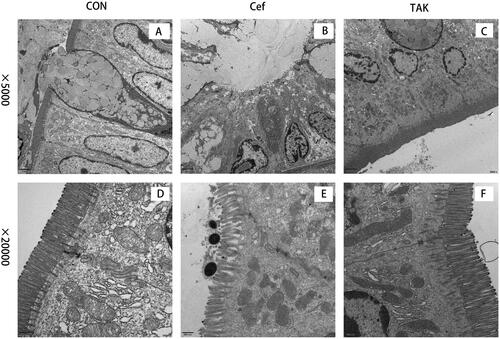
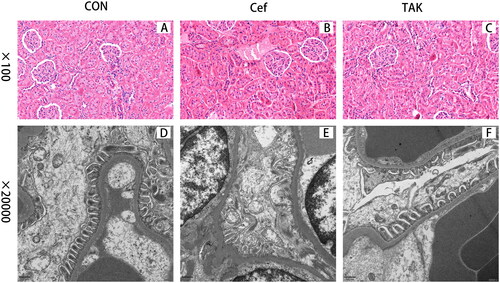
Figure 7. Representative micrographs for Histopathological changes of kidney from the three groups. (A-C) Representative features of CON, Cef, TAK group with light microscopy, (D-F) electron micrographs.
Data availability statement
The datasets used and/or analyzed during the current study available from the corresponding author on reasonable request.