
Figures & data
Figure 1. Flow diagram of the selection of eligible participants.
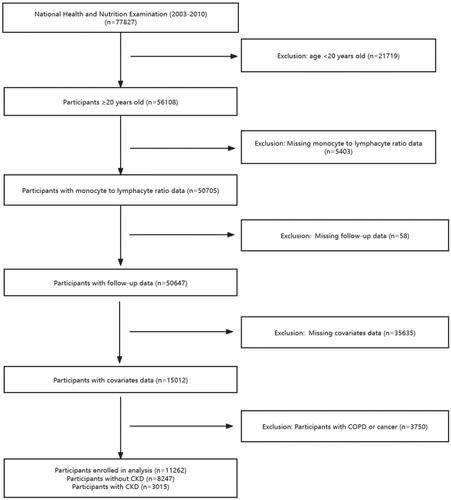
Table 1. Clinical features of the participants with or without CKD.
Table 2. The partial correlations of MLR and clinical characteristics.
Figure 2. Kaplan-Meier survival curve for mortality by MLR quartiles.
Kaplan-Meier survival curve for all-cause mortality (A) and CVD mortality (B) by MLR.
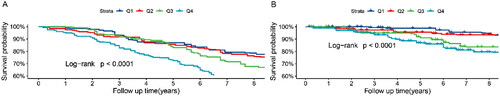
Table 3. Weighted association between MLR and mortality.
Figure 3. Restricted cubic spline fitting for the association between MLR with mortality.
The association of MLR levels with the all-cause (A) and CVD (B) mortality.
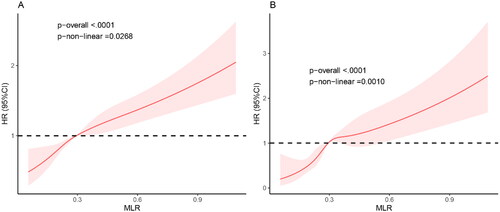
Figure 4. ROC curves of the MLR for predicting mortality.
ROC curves and AUC values of the MLR for predicting all-cause mortality (A) and cardiovascular mortality (B)
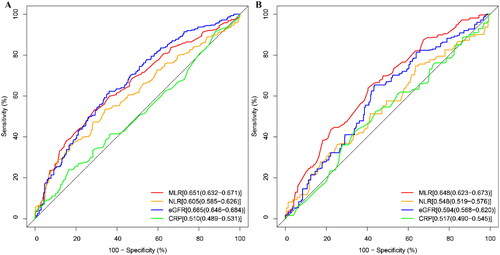
Table 4. The efficacy of MLR in predicting all-cause mortality and CVD mortality.
Supplemental Material
Download MS Word (31.4 KB)Data availability statement
All analyses during the current study are available in the National Health and Nutrition Examination Survey. This project was supported by the National Natural Science Foundation of China (No. 81870336).