
Figures & data
Table 1. Demographic and clinical characteristics in derivation cohort and validation cohort.
Table 2. Logistic regression analysis of variables assessing proteinuria in derivation cohort.
Figure 1. ROC curve of the risk model for the derivation and validation cohort.
Area under the ROC curve to determine the assessing ability of the model in two cohorts, respectively, representing the sensitivity on the ordinate axis and specificity in the abscissa. Blue represents ROC curve of the Derivation cohort. Red represents ROC curve of the Validation cohort.
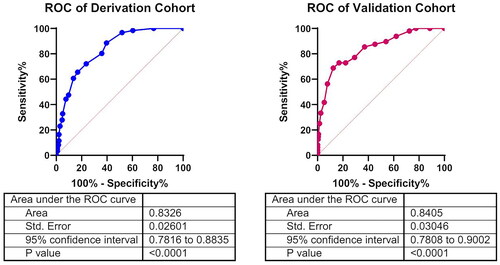
Table 3. The point assignment for assessing variables in the derivation cohort.
Table 4. Diagnostic accuracy of the assessing score for after omicron proteinuria in derivation cohort and validation cohort.