
Figures & data
Table 1. Descriptive statistics of age, trait-perseverative negative thinking, alexithymia, and the pre- and post-measure of subjective health complaints
Figure 1. Mean worry duration in minutes per group over the course of the intervention period.
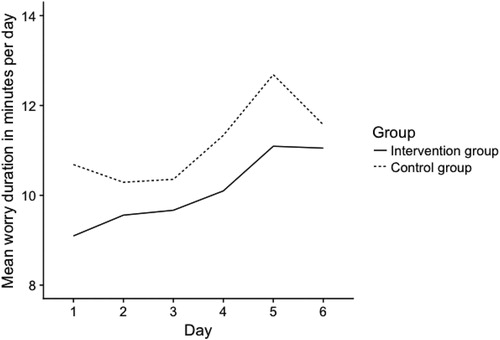
Figure 2. Mean number of worry episodes per group over the course of the intervention period.
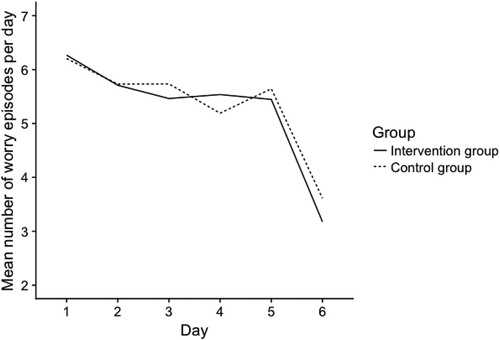
Table 2. Descriptive statistics of worry frequency and worry duration throughout the week.
Table 3. Bivariate correlations between all constructs.
Table 4. Moderation model results for all predictors, the moderator and for the two mediators in the model for the effect on the difference score of SHCa (T2.17).