
Figures & data
Figure 1. The Health Action Process Approach model (Schwarzer, Citation2008).
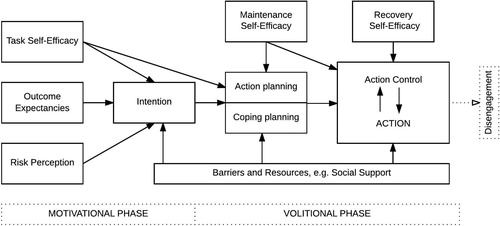
Table 1. Baseline characteristics by group.
Table 2. Descriptive statistics for outcome measures by time and group.
Figure 2. Flowchart of the participants throughout the trial.
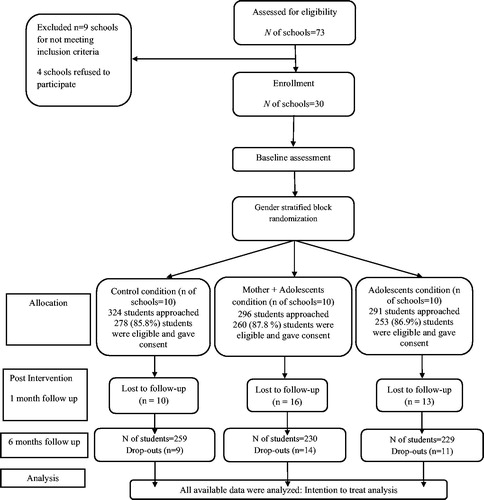
Table 3. Three-level linear mixed models predicting the effects of the intervention on tooth brushing (TB), dental plaque (DP), Parent Social Support (PSS), Outcome Expectancies (OE), Risk Perceptions (RP) and Self-monitoring (SM).
Table 4. Three-level Linear Mixed Models Predicting the Effects of the Intervention on Self-Efficacy (SE), Intention (INT), Action Planning (AP), Coping Planning (CP), community periodontal index (CPI), and oral health related quality of life (OHRQOL).