
Figures & data
Table 1. Outcomes of age, gender, body mass index (BMI), self-control, self-efficacy, hunger, healthy eating goal and goal to be physically active, separately for the control condition and experimental condition.
Figure 1. Mean and standard error of the mean for the relative food preference (a higher score on the y-axis represents a more healthy food preference) on healthiness tradeoff pairs (H tradeoff pairs; left panel) and pairs differing in healthiness as well as attractiveness (H + A tradeoff pairs; right panel) in the control condition versus the experimental condition. In this figure, the experimental condition shows a trend towards a more healthy food preference, compared to the control condition on H tradeoff pairs, but no significant differences are shown for H + A tradeoff pairs.
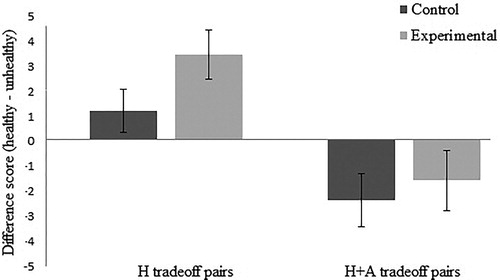
Table 2. Outcomes on self-reported food preference, self-reported food choice, actual food choice and physical activity, separately for the control condition and experimental condition, without correction for the covariates.
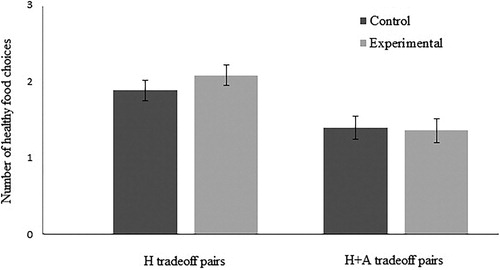
Figure 2. Mean and standard error of the mean for number of self-reported healthy food choices on healthiness tradeoff pairs (H tradeoff pairs; left panel) and pairs differing in healthiness as well as attractiveness (H + A tradeoff pairs; right panel) in the control condition versus the experimental condition. In this figure, no significant differences are shown between the experimental and control condition in number of healthy food choices on H tradeoff pairs and H + A tradeoff pairs.
Supplemental Material
Download MS Word (10.4 KB)Data availability statement
Data will be submitted to DANS (https://dans.knaw.nl/nl) after acceptance of the manuscript.
©ViaNova is developed by Leiden University, Health Medical and Neuropsychology Unit in collaboration with Delft University of Technology.