
Figures & data
Figure 1. Flow-chart of the study sample. N represents the number of couples.
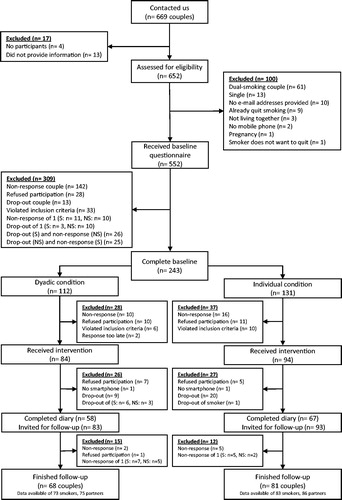
Table 1. Mean baseline characteristics for the dyadic and individual planning group.
Table 2. Smoking behaviour at follow-up and smoking patterns in the diary as reported by smokers.
Table 3. Proportion of prolonged smoking abstainers (7, 14 and 21 subsequent days of reported not smoking) reported by smokers, and average daily relationship satisfaction per week of both members of the couples.
Table 4. Bootstrap regression model of number of cigarettes at follow-up (n = 144 smokers) and multilevel model of relationship satisfaction at follow-up (n = 167 subjects).
Data availability statement
The data that support the findings of this study are available from the corresponding author, Anne Buitenhuis, upon reasonable request.