Figures & data
Table 1. Descriptive statistics of within day variables assessed in study 1.
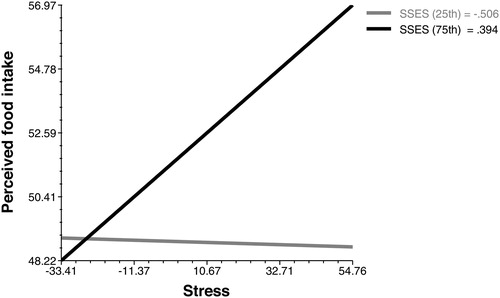
Figure 1. Relationship between stress and food craving moderated by the Salzburg Stress Eating Scale (SSES) in study 1.
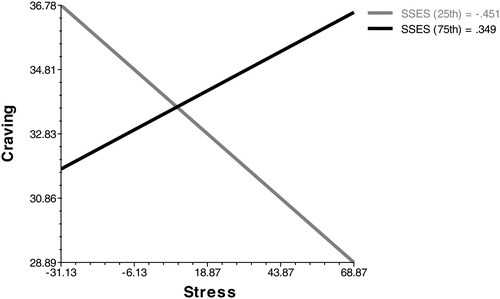
Table 2. Multilevel models of study 1.
Figure 2. Relationship between stress and food craving moderated by the Salzburg Stress Eating Scale (SSES) in study 1.
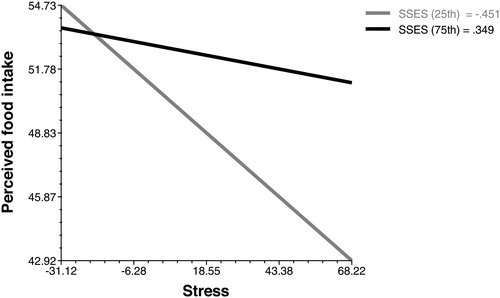
Table 3. Descriptive statistics of within day variables assessed in study 2.
Figure 3. Relationship between stress and food craving moderated by the Salzburg Stress Eating Scale in study 2.
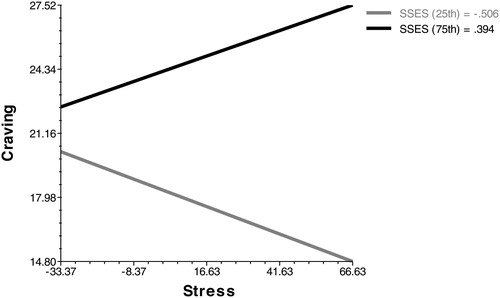
Table 4. Multilevel models of study 2.
Figure 4. Relationship between stress and food craving moderated by the Salzburg Stress Eating Scale (SSES) in study 2.