
Figures & data
Figure 1. Hypothetical model.
Note. Simplified version of the hypothetical model used in the present study.
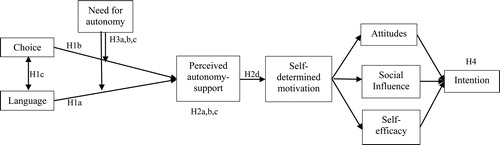
Figure 2. Flow chart of participant progress.
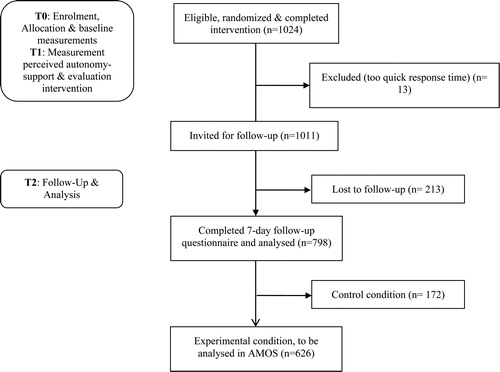
Table 1. Example of smoking cessation advice.
Figure 3. Hypothesized structural model with significant paths.
Note. Results are presented as standardized total effects. For clarity, items of latent variables (ellipse) are not presented. Observed variables are presented as rectangles. Cog = cognitive advantages of smoking cessation. Phy = physical advantages of smoking cessation. Con = disadvantages of smoking cessation. Dotted lines represent non-significant paths. Straight lines represent significant paths (p < .05).
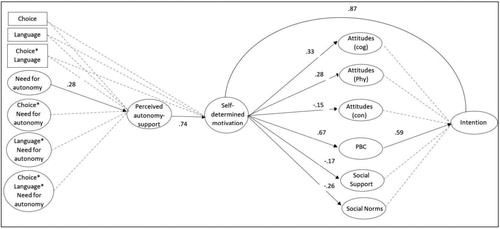
Table 2. Comparison of participants who completed the study with those who dropped out.
Table 3. Fit indices of the measurement model.
Table 4. Means of perceived autonomy-support and need for autonomy per experimental condition (n = 626).Table Footnotea
Appendix I. Indirect & direct effects.
Supplemental Material
Download MS Word (14.5 KB)Data availability statement
The data that support the findings of this study are available from the corresponding author, MA, upon reasonable request.