Figures & data
Figure 1. Cumulative distribution curves of the erythrocyte count data in LPs of pediatric hemato-oncology patients (red line) and reference populations (blue line).
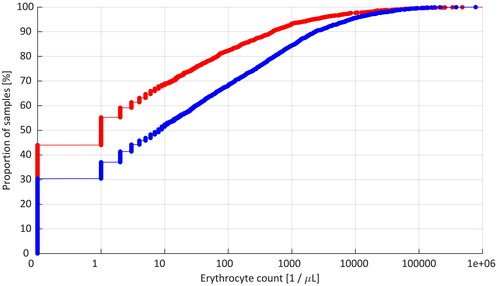
Figure 2. Cumulative distribution curves of the erythrocyte count data in the first diagnostic LPs (open circles) and subsequent intrathecal treatment LPs (solid circles) in pediatric hemato-oncology patients.
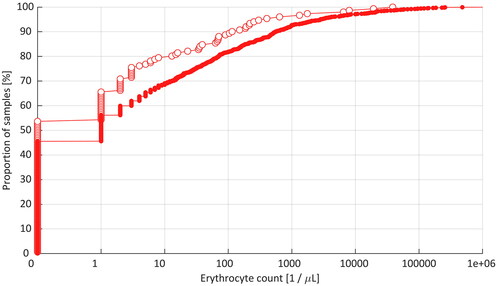
Figure 3. Incidence of traumatic lumbar puncture (TLP) in pediatric hemato-oncologic patients (red bars) and reference patients (blue bars) broken down by the time category since the previous first LP procedure.
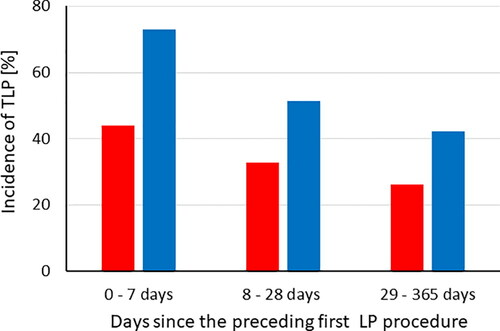
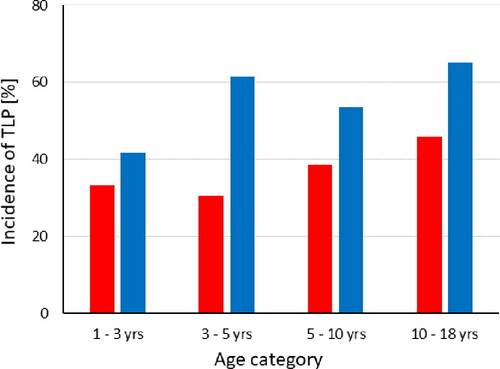
Figure 4. Incidence of traumatic lumbar puncture (TLP) in pediatric hemato-oncology patients (red bars) and reference patients (blue bars) in the next LP after the previous first LP procedure in four age categories.