
Figures & data
Figure 1. CD19+ B cell subpopulations were significantly increased in African American (AA) patients diagnosed with AIH compared to European ancestry (EA): whole blood was collected from Healthy controls (HC), African Americans (AA) European ancestry (EA) patients diagnosed with autoimmune hepatitis (AIH). PBMC were isolated and stained with live dead cells and stained with antibodies to CD3, CD19 and subjected to Flowcytometry. Bar graphs represent CD19 positive cells in total lymphocytes, B, C and D are representative flowjo charts from HC, AA, EA respectively. Bar plots represent mean and ± SD.
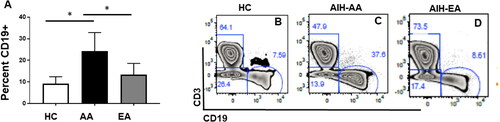
Figure 2. DN2 cells [CD19+] IgD-CD27-CD11c+CD21- which are precursors of plasmablasts are increased in patients with AIH: whole blood was collected from Healthy controls (HC), African Americans (AA) European ancestry (EA) patients diagnosed with autoimmune hepatitis (AIH). PBMC were isolated and stained antibodies to CD3, CD19, IgD, CD27 and subjected to Flowcytometry. A, B, and C are representative flow charts and D, E, F are representative bar graphs of Unswitched memory [CD19+] IgD+CD27+) cells from HC, AA, EA respectively. Bar plots represent mean and ± SD.
![Figure 2. DN2 cells [CD19+] IgD-CD27-CD11c+CD21- which are precursors of plasmablasts are increased in patients with AIH: whole blood was collected from Healthy controls (HC), African Americans (AA) European ancestry (EA) patients diagnosed with autoimmune hepatitis (AIH). PBMC were isolated and stained antibodies to CD3, CD19, IgD, CD27 and subjected to Flowcytometry. A, B, and C are representative flow charts and D, E, F are representative bar graphs of Unswitched memory [CD19+] IgD+CD27+) cells from HC, AA, EA respectively. Bar plots represent mean and ± SD.](/cms/asset/5f1ed00c-cc4f-466a-82a8-266cb7c0b235/iaut_a_2356089_f0002_c.jpg)
Figure 3. DN2 cells [CD19+] IgD-CD27-CD11c+CD21- which are precursors of plasmablasts are increased in patients with AIH: whole blood was collected from Healthy controls (HC), African Americans (AA) European ancestry (EA) patients diagnosed with autoimmune hepatitis (AIH). PBMC were isolated and stained with live dead cells and stained with antibodies to CD3, CD19, IgD, CXCR5, CD21, CD11c and subjected to Flowcytometry. Bar graphs represent [CD19+] IgD+CXCR5-CD11c + DN2 cells, B, C and D are representative flowjo charts from HC, AA, EA respectively. Bar plots represent mean and ± SD.
![Figure 3. DN2 cells [CD19+] IgD-CD27-CD11c+CD21- which are precursors of plasmablasts are increased in patients with AIH: whole blood was collected from Healthy controls (HC), African Americans (AA) European ancestry (EA) patients diagnosed with autoimmune hepatitis (AIH). PBMC were isolated and stained with live dead cells and stained with antibodies to CD3, CD19, IgD, CXCR5, CD21, CD11c and subjected to Flowcytometry. Bar graphs represent [CD19+] IgD+CXCR5-CD11c + DN2 cells, B, C and D are representative flowjo charts from HC, AA, EA respectively. Bar plots represent mean and ± SD.](/cms/asset/ccf4868a-2ed0-43ce-bb22-d53d8a58af21/iaut_a_2356089_f0003_c.jpg)
Figure 4. Activated Naïve (aN, CD19+/IgD+CD27-/CD11c+CD21-) cells are significantly higher in AA patients with AIH compared to EA: whole blood was collected from Healthy controls (HC), African Americans (AA) European ancestry (EA) patients diagnosed with autoimmune hepatitis (AIH). PBMC were isolated and stained with live dead cells and stained with antibodies to CD3, CD19, IgD, CD11c, CD21 and subjected to Flowcytometry. Bar graphs represent activated naïve (CD19+/IgD+CD27-/CD11c+CD21-) cells, B, C and D are representative flowjo charts from HC, AA, EA respectively. Bar plots represent mean and ± SD.
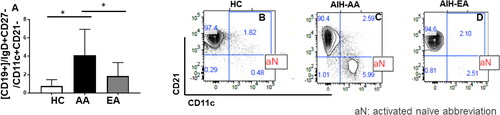
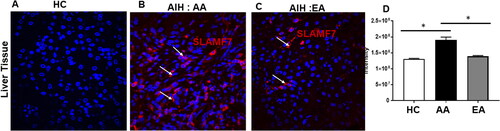
Figure 5. Signalling Lymphocytic Activation Molecule F7 (SLAMF7), a plasma cell marker is increased in AA patients with AIH: Liver tissues showing SLAMF7 staining in red and nuclear stain DAPI is in blue. Images were taken in fluorescent microscope Deltavision OMX Super resolution microscope.
Data availability statement
Data will be available upon request.