
Figures & data
Table 1. Demographic and clinical characteristics of the study groups.
Table 2. The distribution of aPLs tests in the study groups.
Figure 1. TVRβ repertoire diversity and clonal expansion in OAPS patients.
(A) Unique clone number. (B) Shannon’s diversity index. (C) Simpson index. (D) Evenness. (E) CDR3 length and quantity distribution among groups. ***P ≤ 0.001, **P ≤ 0.01, *P ≤ 0.05 and ns P > 0.05.
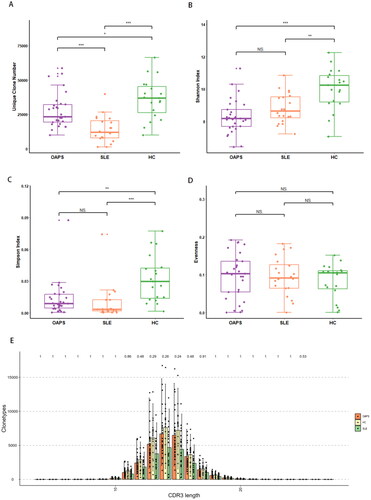
Figure 2. Gene usage analysis of the TCRβ repertoires. Frequency of V gene (A) and J gene (B) usage in three groups. (C)The CDR3 amino acid sequence was different between OAPS patients and healthy controls. (D)Corresponding V/J gene combination of different CDR3 amino acid sequences between the two groups.
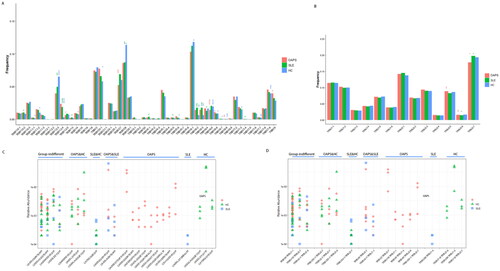
Figure 3. Association between TCRβ repertoire and clinical markers in patients with OAPS. (A)The correlation between V/J genes and clinical indices. (B)Cumulative probability curve of adverse pregnancy events grouped by high or low diversity.
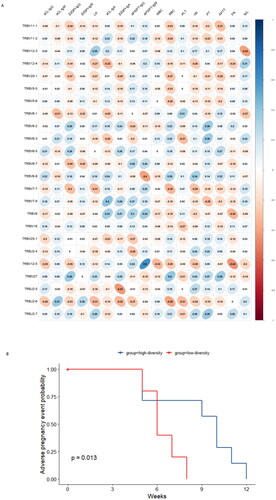
Figure 4. Receiver operating characteristic (ROC) analysis for OAPS classification by three laboratory indicators model (Model-1) and specific TCRβ repertoire model (Model-2). (A-C) Discriminate OAPS from health controls; (D-F) Discriminate OAPS from SLE patients.
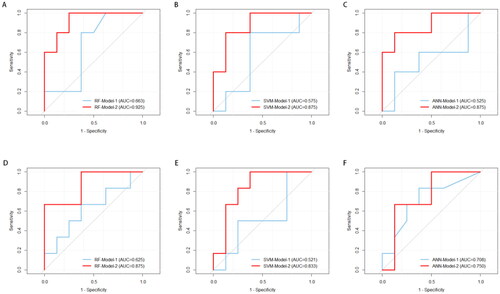
Table 3. Logistic regression analysis of variables in predicting the OAPS.
Table 4. Validation and comparison of OAPS binary prediction models.
Data availability statement
The data that support the findings of this study are available on request from the corresponding author, LY Cui, upon reasonable request.