
Figures & data
Figure 1. (A) Experimental design. (B) Subchronic LPS/IN treatment impairs body weight increase in female NZBWF1 mice. The asterisk indicates a significant difference (p < 0.05) for VEH/IN vs LPS/IN. (C) in LPS, instillation increases total leukocyte, monocyte, neutrophil, and lymphocyte counts in the BALF. Letters: a, significantly different from VEH control within the same route of exposure (p < 0.05); b, significantly different from LPS/IP group (p < 0.05).
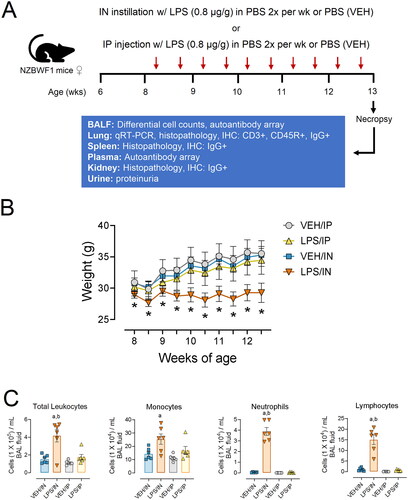
Figure 2. Light photomicrographs of hematoxylin and eosin-stained lung tissue sections from intranasally with instilled saline vehicle-alone mouse (VEH/IN) at (A) low and (B) high magnification; intranasally instilled LPS mouse (LPS/IN) at (C) low and (D) high magnification; intraperitoneally instilled saline vehicle-alone mouse (VEH/IP) at (E) low and (F) high magnification; and intraperitoneally instilled LPS mouse (LPS/IP) at (G) low and (H) high magnification. Abbreviations: a, alveolar parenchyma; ba, bronchiolar airway. Arrows: stippled arrow in (B), foreign body circumscribed by macrophage/monocytes; solid arrows in (C), perivascular/peribronchiolar lymphoid cells; open-faced arrows in (D), hyperplasia of type 2 alveolar epithelial cells. Numbers: 1 in (D), macrophages/monocytes in alveolar lumen; 2 in (D), neutrophils in alveolar lumen; 3 in (D), plasma cells in perivascular interstitial tissue; 4 in (D), lymphoid cells in perivascular interstitial tissue.
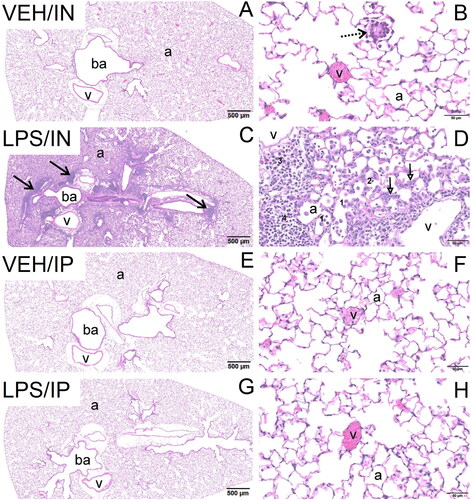
Figure 3. Intranasal (IN) but not intraperitoneal (IP) LPS exposure induces expression of (A) cytokine, (B) chemokine, (C) IFN-regulated, and (D) cell death-related genes in the lung. Quantitative RT-PCR was used to assess exposure-dependent changes in gene expression within the lung tissue. Letters: a, differs from VEH control within the same route of exposure (p < 0.05); b, differs from LPS/IP group (p < 0.05).
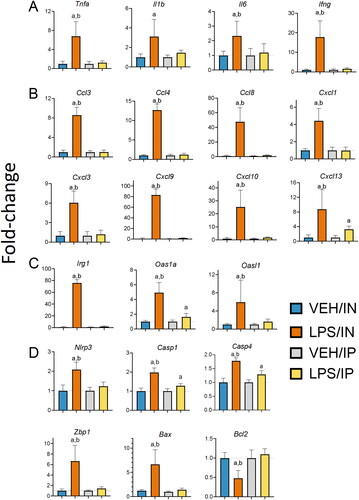
Figure 4. Intranasal (IN) LPS exposure increases lung infiltration of perivascular B-cells and T-cells. Representative light photomicrographs of perivenous ectopic lymphoid tissue (ELT) immunohistochemically stained for (A) CD45R+ B lymphoid cells and (C) CD3+ T cells in lungs from VEH/IN and LPS/IN mice. Abbreviations: pv, pulmonary vein; ba, bronchiolar airway; i, peribronchiolar and perivascular interstitium; a, alveolar parenchyma. Arrows: low power (left), peri-vascular/bronchiolar ectopic lymphoid tissue; high power (right), positively stained lymphoid cells. IN LPS exposure triggered significant interstitial infiltration of (A) CD45R+ B-cells and (C) CD3+ T-cells compared to VEH/IN mice. Graphical representation of morphometrically determined density of CD45R+ B-cells (B) and CD3+ T-cells (D) in lung tissue from VEH/IN and LPS/IN mice. Asterisks: *** p < 0.001, **** p < 0.0001 for VEH/IN vs LPS/IN.
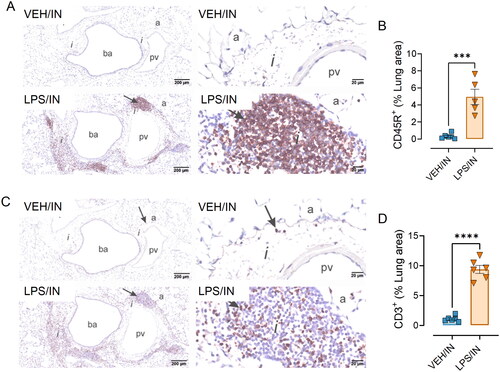
Figure 5. Intranasal (IN) LPS exposure induces increased numbers of pulmonary IgG+ plasma cells in the lung. (A) Representative light photomicrographs of perivenous ectopic lymphoid tissue (ELT) immunohistochemically stained for IgG+ plasma cells (solid arrows) and alveolar parenchyma immunohistochemically stained for extracellular IgG+ proteinaceous material (stippled arrows) in alveolar airspace. (B) Zoomed in photomicrographs IgG+ stained tissue around pulmonary vessel in LPS exposed mice. Abbreviations: tb, terminal bronchiole; e, epithelium; v, pulmonary vein; a; alveolar parenchyma; els, ectopic lymphoid structure/tissue. (C) Graphical representation of morphometrically determined lung density of IgG+ plasma cells. LPS/IP treatment did not lead to increased IgG+ plasma cell infiltration, but extracellular IgG deposition in lung tissue was still present. Tissues counterstained with hematoxylin; letters: a, significantly different from VEH control within the same route of exposure (p < 0.05); b, significantly different from LPS/IP group (p < 0.05).
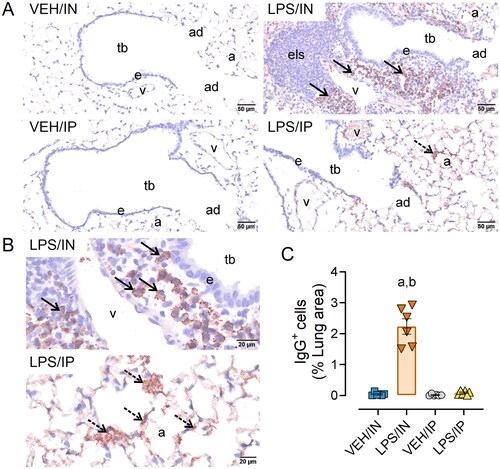
Figure 6. Intranasal (IN) and intraperitoneal (IP) LPS exposure induce splenomegaly and splenic IgG deposition. (A) Spleen weights from LPS/IP and LPS/IN mice were significantly greater compared to VEH/IP and VEH/IN mice, respectively. Letters: a, significantly different from VEH control within the exact route of exposure (p < 0.05); b, significantly different from LPS/IP group (p < 0.05). (B) Increased IgG deposition was evident in the IN/LPS and IP/LPS groups. Light photomicrographs of splenic tissue immunohistochemically stained for extracellular IgG+ proteinaceous material and counterstained with hematoxylin. Solid arrows indicate IgG+ stained tissue. Abbreviations: wp, white pulp; rp, red pulp; gc, germinal center. Splenic white pulp increased (lymphoid cell hyperplasia) in mice exposed to LPS IP and IN. Germinal center formation (stippled arrows) present in LPS/IP mice.
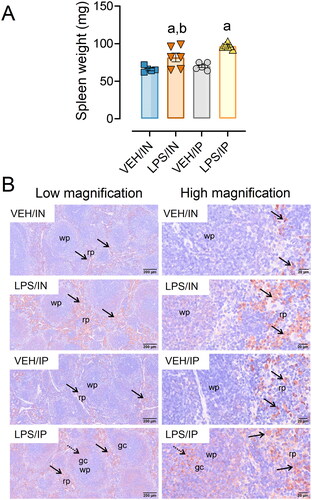
Figure 7. Intranasal (IN) LPS exposure elicits broad IgM AAb response in BALF. AAb production was measured in BALF samples collected at the time of necropsy. (A) Heat map illustrates unsupervised clustering (euclidian distance method) of 122 AAbs shown as AAb-score values for IgM expression in BALF. Scale bar values reflect the range of variance-stabilized AAb scores, which were centered across rows. (B) IN LPS exposure increased total IgM levels in the BALF. (C) PCA of differentially expressed IgM AAbs in the BALF of VEH and LPS-exposed mice for both routes of exposure. Ellipses illustrate 95% confidence intervals. (D) in LPS exposure led to increases in various classes of IgM AAbs compared to their respective VEH control mice. Letters: a, significantly different from VEH control within the same route of exposure (p < 0.05); b, significantly different from LPS/IP group (p < 0.05).
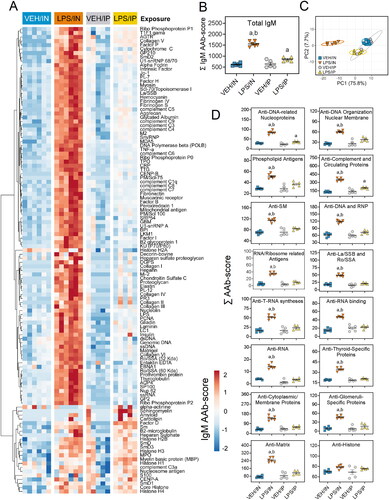
Figure 8. Intranasal (IN) LPS exposure diverse IgG AAb response in the BALF. (A) AAb heat maps were constructed as described in legend. (B) IN LPS exposure increased total IgG levels in the BALF. (C) PCA of differentially expressed IgG AAbs in the BALF of VEH and LPS-exposed mice for both routes of exposure. Ellipses illustrate 95% confidence intervals. (D) Both IP and in LPS exposure led to increases in various classes of AAbs in the BALF compared to their respective VEH control mice. Letters: a, significantly different from VEH control within the same route of exposure (p < 0.05); b, significantly different from LPS/IP group (p < 0.05).
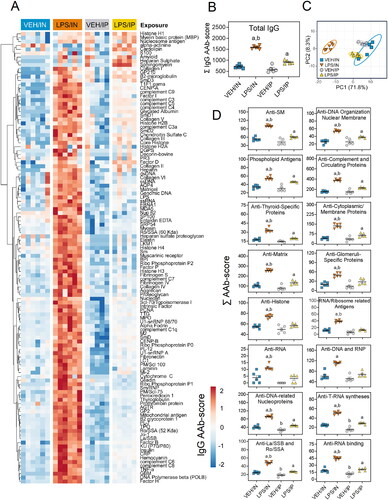
Figure 9. Intraperitoneal (IP) LPS exposure triggers more robust IgM AAb responses in plasma than intranasal (IN) LPS treatment. (A) AAb heat maps constructed as detailed in legend. (B) IP and in LPS exposure increased total IgM levels in the plasma. (C) PCA of differentially expressed IgM AAbs in the plasma of VEH and LPS-exposed mice for both routes of exposure. Ellipses illustrate 95% confidence intervals. (D) Both IP and in LPS exposure led to increases in various classes of AAbs in the plasma compared to their respective VEH control mice. Letters: a, significantly different from VEH control within the same route of exposure (p < 0.05); b, significantly different from LPS/IP group (p < 0.05).
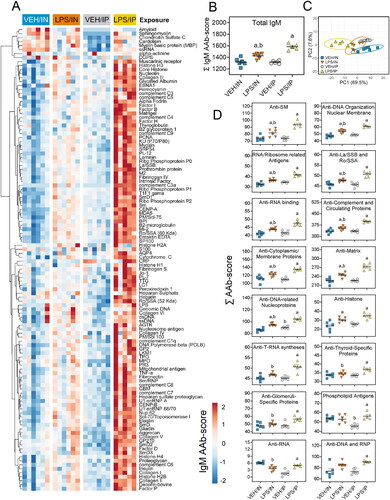
Figure 10. Both intranasal (IN) and intraperitoneal (IP) LPS exposures elicit diverse IgG AAbs in the plasma. (A) AAb heat maps constructed as detailed in legend. (B) IP and in LPS exposure increased total IgG AAb levels in the plasma. (C) PCA of differentially expressed IgG AAbs in the plasma of VEH and LPS-exposed mice for both routes of exposure. Ellipses illustrate 95% confidence intervals. (D) Both IP and in LPS exposure led to increases in various classes of AAbs in the plasma compared to their respective VEH control mice. Letters: a, significantly different from VEH control within the same route of exposure (p < 0.05); b, significantly different from LPS/IP group (p < 0.05).
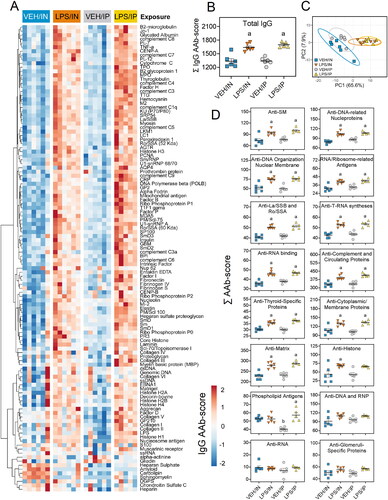
Figure 11. Intranasal (IN) and intraperitoneal (IP) LPS delivery induce glomerulonephritis. (A) Individual kidney sections were semi-quantitatively scored based on the modified international society of nephrology/renal pathology lupus nephritis classification system as described in materials and methods. Mice in both the IN and IP LPS cohorts exhibited elevated glomerulonephritis scores compared to respective VEH controls. The letter a indicates significantly different from VEH control within the same route of exposure (p < 0.05). (B) Light photomicrographs of kidney sections stained with periodic acid schiff (PAS) stain (left panel, arrows indicate moderately hypertrophic and hypercellular glomeruli) or immunohistochemically stained with IgG (right panel, arrows indicate red-brown chromogen) and counterstained with hematoxylin. Abbreviations: g, glomerulus; rt, renal tubule. LPS/IN mice exhibited mild glomerular hypertrophy (solid arrows) and little IgG deposition (stippled arrows) compared to VEH/IN mice, and LPS/IP mice had marked glomerular hypertrophy (solid arrows) and mild IgG deposition (stippled arrows) compared to VEH/IP mice.
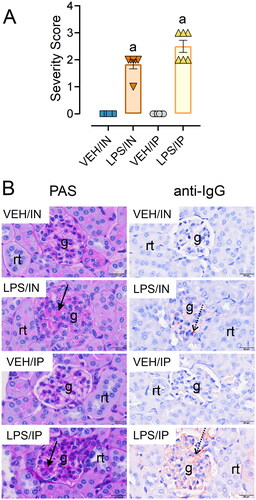
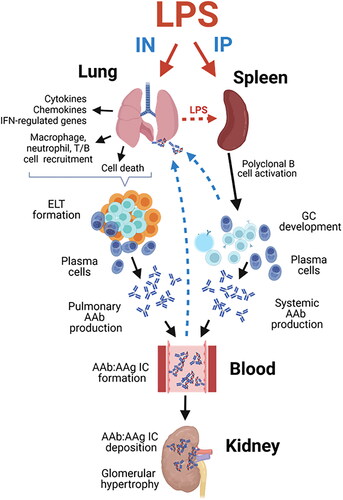
Figure 12. Putative mechanisms for differential effects of intranasal (IN) and intraperitoneal (IP) LPS exposure on pulmonary inflammation, tissue-specific AAb production, AAb-AAg immune complex formation/deposition, and renal inflammation in NZBWF1 mice. Glomerulonephritis in LPS/IN mice likely primarily resulted from ELT formation, germinal center development, and elevated immunoglobulin (Ig)-producing plasma cells in the lung. In LPS/IP mice, systemic AAb responses and glomerulonephritis likely stemmed from polyclonal B-cell activation and Ig-secreting plasma cells located in the spleen. Illustration created with BioRenderTM .
Data availability statement
Original IgM and IgG AAb scores for BALF and plasma are available in a publicly accessible repository: https://doi.org/10.5061/dryad.m905qfv6h.