Figures & data
Figure 1. Fentanyl aggravated dextran sodium sulfate (DSS)-triggered colitis. We fed 3% DSS water to mice on days 0–7. PBS (control) or fentanyl (0.1, 0.25, or 0.5 mg/kg) was intraperitoneally administered on days 0–6 (n = 10 each group). Euthanasia of the mice was performed on day 7. (A–C) Mice were assessed daily for weight, diarrhea, and hematochezia; (D) Disease activity index (DAI) was calculated on the basis of weight change, diarrhea, and hematochezia; (E) Colon lengths; (F) Progressive stages of colitis development; (G) 100× of representative hematoxylin and eosin (H&E)-stained sections of colon (structure: e, epithelial disruption; I, inflammatory infiltration); (H) Histology activity index (HAI) based on epithelial disruption and inflammatory infiltration. Data are mean ± SEM of experiments (10 mice per group). Asterisks represent significance in fentanyl treatment (0.1, 0.25, or 0.5 mg/kg) compared to the PBS control in A, B, C, and D, respectively. *p<.05; **p<.01; ***p<.001.
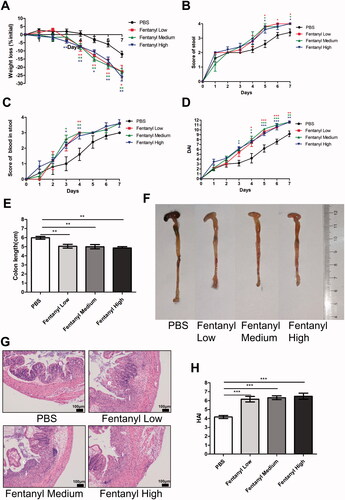
Figure 2. Fentanyl exhibited no obvious effects on the serum levels of adrenocorticotropic hormone (ACTH), glucocorticoid (GC), and prostaglandin E2 (PGE-2), while significantly increasing the synthesis of multiple inflammatory cytokines and chemokines in the colonic mucosa from dextran sodium sulfate (DSS) model. PBS (control) or fentanyl (0.1, 0.25, or 0.5 mg/kg) was intraperitoneally administered on days 0–6 (n = 10 each group). Euthanasia of the mice was performed on day 7. (A) The serum levels of ACTH, GC, and PGE-2 by enzyme-linked immunosorbent assay (ELISA); (B) The expression of inflammatory cytokines/chemokines in the colonic mucosa by multiplex ELISA. Data are mean ± SEM of experiments (10 mice per group). *p<.05; **p<.01; ***p<.001.
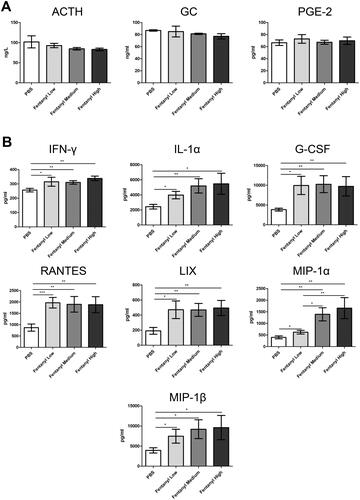
Figure 3. Fentanyl exacerbated 2,4,6-trinitrobenzenesulfonic acid solution (TNBS)-triggered colitis. Murine acute colitis was triggered by TNBS on day 0. PBS (control) or fentanyl (0.1, 0.25, or 0.5 mg/kg) was intraperitoneally administered on days 0 and 1 (n = 10 each group). Euthanasia of the mice was performed on day 2. (A) Weight change; (B) Percent survival; (C) Colon lengths; (D) Progressive stages of colitis development; (E) 100× of representative hematoxylin and eosin (H&E)-stained sections of colon (structure: e, epithelial disruption; I, inflammatory infiltration); (F) Histology activity index (HAI) based on epithelial disruption and inflammatory infiltration. Data are mean ± SEM of experiments (10 mice per group). Asterisks represent significance in fentanyl treatment group (0.1, 0.25, or 0.5 mg/kg) compared to the PBS control group in A, respectively. *p<.05; **p<.01; ***p<.001.
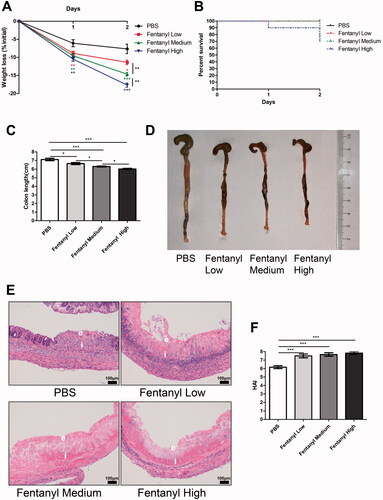
Figure 4. Fentanyl exhibited no significant effects on the serum levels of adrenocorticotropic hormone (ACTH), glucocorticoid (GC), and prostaglandin E2 (PGE-2), while significantly increasing the synthesis of multiple inflammatory cytokines and chemokines in the colonic mucosa from 2,4,6-trinitrobenzenesulfonic acid solution (TNBS)-treated mice. Murine acute colitis was triggered by TNBS on day 0. PBS (control) or fentanyl (0.1, 0.25, or 0.5 mg/kg) was intraperitoneally administered on days 0 and 1 (n = 10 each group). Euthanasia of the mice was performed on day 2. (A) The levels of ACTH, GC, and PGE-2 in the serum by enzyme-linked immunosorbent assay (ELISA); (B) Expression levels of multiple inflammatory cytokines and chemokines in the colonic mucosa by multiplex ELISA. Data are mean ± SEM of experiments (7–10 mice per group). *p<.05; **p<.01; ***p<.001.
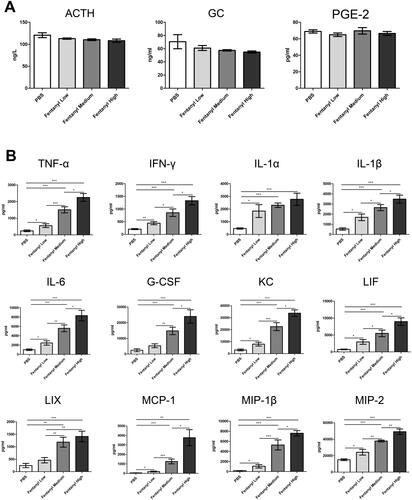
Figure 5. Fentanyl increased the proportions of μ-opioid receptor (MOR)+ Th1 cells and MOR + macrophages of lamina propria mononuclear cells (LPMCs) from the colonic mucosa of dextran sodium sulfate (DSS) and 2,4,6-trinitrobenzenesulfonic acid solution (TNBS) models. LPMCs of colonic mucosa were stained with CD4, IFN-γ, CD11b, F4/80, and MOR, followed by flow cytometry. CD4 + IFN-γ+ cells were considered as Th1 cells; F4/80+ CD11b + cells as macrophages; CD4 + IFN-γ+ MOR + cells as MOR + Th1 cells; and F4/80+ CD11b + MOR + cells as MOR + macrophages. (A) MOR + Th1 cells and MOR + macrophages were isolated from Th1 cells and macrophages of LPMCs from the colonic mucosa of DSS- and TNBS-administered mice exposed to PBS or medium-dose fentanyl (0.25 mg/kg; n = 5 each group), respectively; (B) Proportion statistics of Th1 cells, MOR + Th1 cells, macrophages, and MOR + macrophages of LPMCs. Data are mean ± SEM of experiments (5 mice per group). *p<.05; **p<.01; ***p < 0.001 (fentanyl-treated vs. PBS control in the DSS or TNBS model).
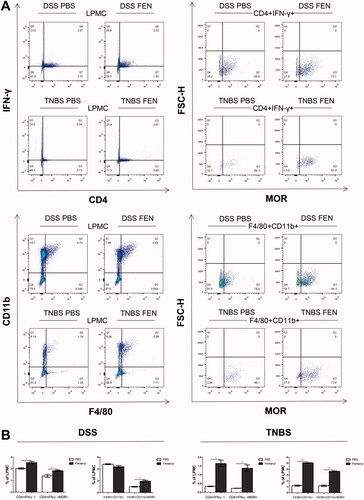
Figure 6. Fentanyl upregulated the production of inflammatory cytokines and chemokines in μ-opioid receptor (MOR)+ macrophages in the colonic lamina propria mononuclear cells (LPMCs) of dextran sodium sulfate (DSS) model, but failed to induce the synthesis of most inflammatory cytokines and chemokines from MOR + macrophages of the colonic LPMCs from 2,4,6-trinitrobenzenesulfonic acid solution (TNBS) model. The same quantity of flow-sorted MOR + macrophages were collected from each group (DSS control, DSS medium-dose fentanyl, TNBS control, and TNBS medium-dose fentanyl groups), and cultivated. The supernatant was analyzed using multiplex enzyme-linked immunosorbent assay (ELISA) after incubation for 24 h. The figure shows inflammatory cytokines and chemokines synthesized by F4/80 + CD11b + MOR + cells of LPMCs from each group. Experiments were repeated four times. *p<.05; **p<.01; ***p<.001 (fentanyl-treated vs. PBS control in the DSS or TNBS model).
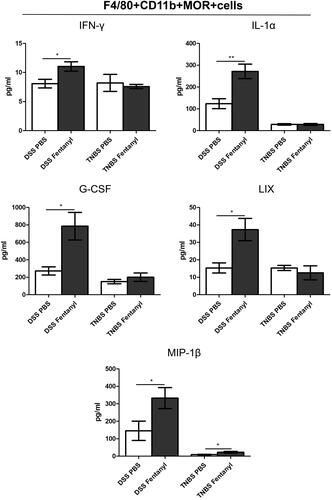
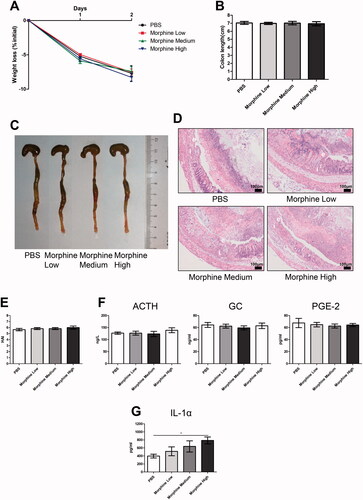
Figure 7. Morphine exhibited no significant effect on the colitis of dextran sodium sulfate (DSS) model. We fed 3% DSS water to mice on days 0–7. PBS (control) or morphine (1, 2.5, or 7.5 mg/kg) was intraperitoneally administered on days 0–6 (n = 10 each group). Euthanasia of the mice was performed on day 7. (A–C) Mice were assessed daily for weight, diarrhea, and hematochezia; (D) Disease activity index (DAI) was calculated on the basis of weight change, diarrhea, and hematochezia; (E) Colon lengths; (F) Progressive stages of colitis development; (G) 100× of representative hematoxylin and eosin (H&E)-stained sections of colon (structure: e: epithelial disruption; i: inflammatory infiltration); (H) Histology activity index (HAI) based on epithelial disruption and inflammatory infiltration; (I) Serum levels of adrenocorticotropic hormone (ACTH), glucocorticoid (GC), and prostaglandin E2 (PGE-2) using enzyme-linked immunosorbent assay (ELISA); (J) Cytokine levels in the colonic mucosa by multiplex ELISA. Data are expressed as mean ± SEM of experiments (10 mice per group). Asterisk represents significance in morphine treatment (7.5 mg/kg) group compared to the PBS control group in A, respectively. *p<.05; **p<.01; ***p<.001.
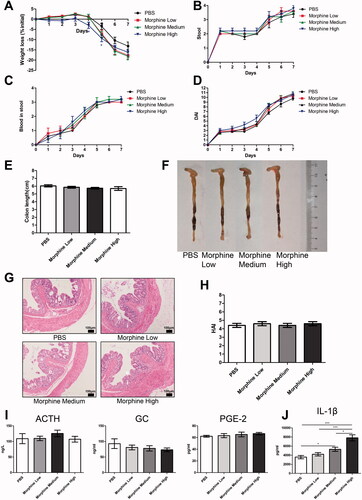
Figure 8. Morphine exerted no significant effect on colitis induced by 2,4,6-trinitrobenzenesulfonic acid solution (TNBS). Acute colitis was triggered by TNBS on day 0. PBS (control) or morphine (1, 2.5, or 7.5 mg/kg) was intraperitoneally administered on days 0 and 1 (n = 10 each group). Euthanasia of the mice was performed on day 2. (A) Weight change; (B) Colon lengths; (C) Progressive stages of colitis development; (D) 100× of representative hematoxylin and eosin (H&E)-stained sections of colon (structure: e: epithelial disruption; i: inflammatory infiltration); (E) Histology activity index (HAI) based on epithelial disruption and inflammatory infiltration; (F) The serum levels of adrenocorticotropic hormone (ACTH), glucocorticoid (GC), and prostaglandin E2 (PGE-2) using enzyme-linked immunosorbent assay (ELISA); (G) Cytokine levels in the colonic mucosa by multiplex ELISA. Data are expressed as mean ± SEM of experiments (10 mice per group). *p<.05; **p<.01; ***p<.001.