Figures & data
Table 1. Compositions of the membranes prepared in this study.
Figure 1. Measured water contact angles on the membrane surface as a function of 4-HBA content.
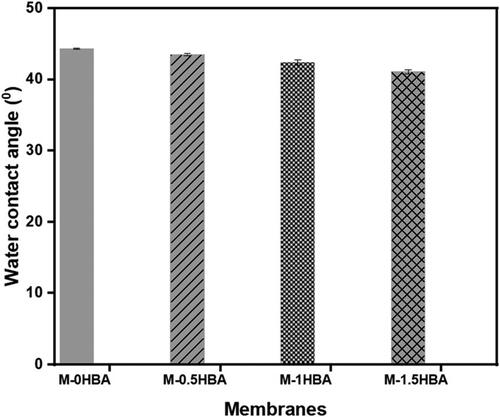
Figure 2. Cross-sectional SEM images of 4-HBA incorporated membranes.
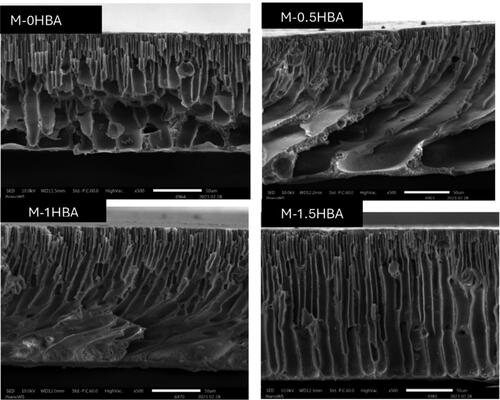
Figure 3. Pure water flux at different transmembrane pressures for all the membranes studied.
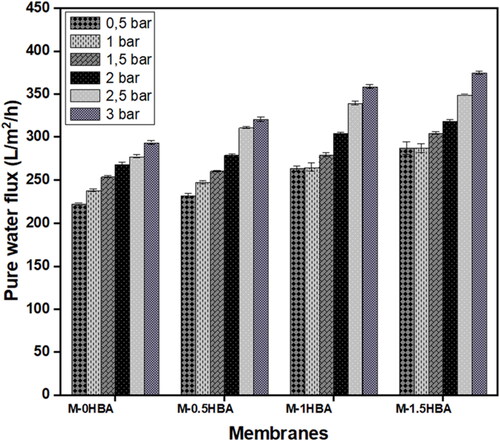
Figure 4. Reduction in bacterial concentration in terms of absorbance at 600 nm before and after membrane filtration over 90 min.
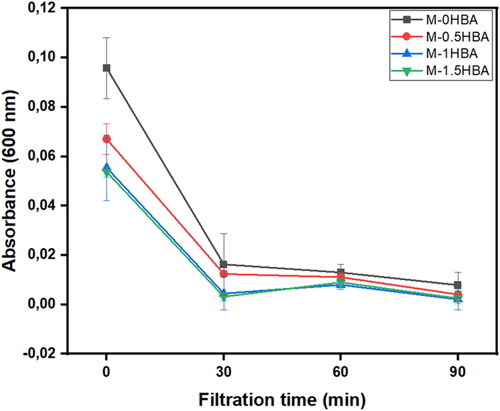
Figure 5. (a) Membrane efficiency in removing bacteria over time, (b) bacterial synthetic water permeate flux, (c) membrane M-1HBA before filtration, (d) M-1HBA after filtration and (e) M-1HBA after cleaning.
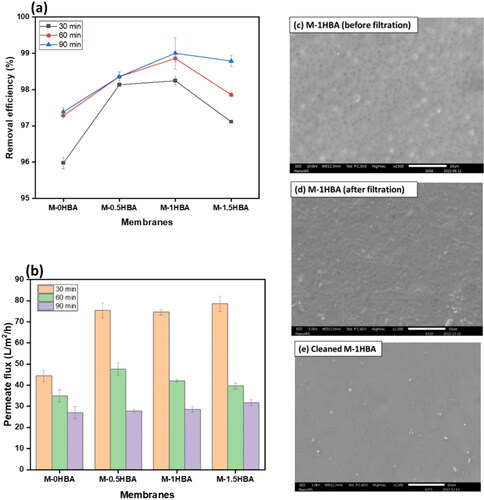
Table 2. Membrane performance removal of bacteria from environmental water samples in nutrient agar.
Figure 6. Removal efficiency of DOM in terms of UV absorbance nm using all the membranes investigated.
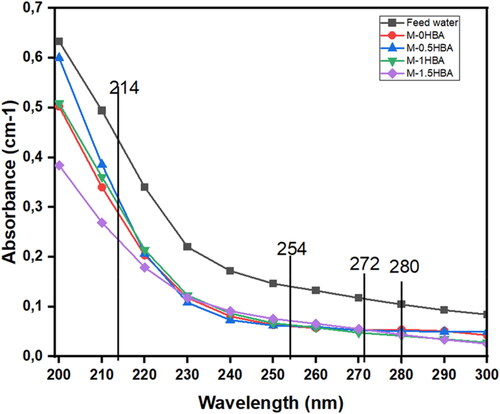
Table 3. Removal efficiency of DOM in terms of UV absorbance in feed water and membrane filtrates.
Figure 7. FEEM chromophores detected before and after filtration using the prepared membranes.
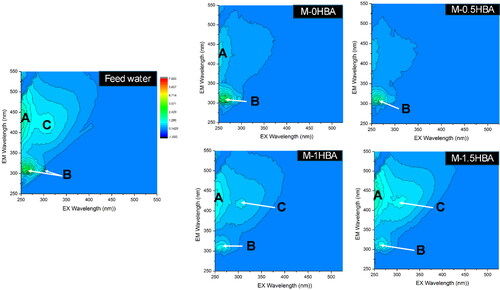
Figure 8. Bacterial colony growth on 4-HBA treated and untreated water samples; (a) untreated, (b) 5 mg, (c) 10 mg and (d) 15 mg 4-HBA treated water samples.
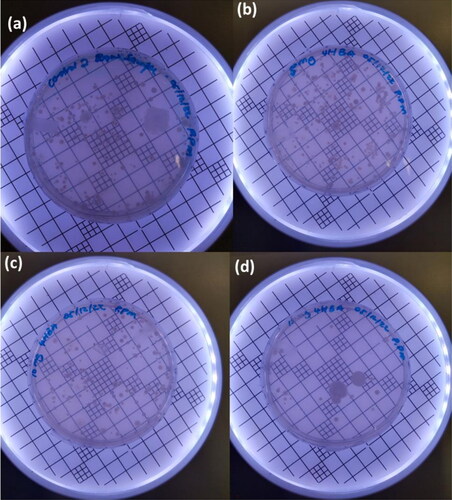
Table 4. Bacterial count and reduction percentage for 4-HBA antimicrobial efficiency determination.
Figure 9. Normalised flux for chemical and ultrasonic cleaning methods over 270 min of filtration: (a) bacterial suspension and (b) a mixture of bacteria cells and HA.
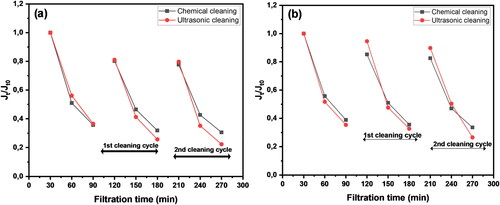
Table 5. Effect of membrane cleaning on flux recovery and reversible and irreversible fouling ratios.
Figure 10. Normalised flux for chemical and ultrasonic cleaning methods over 270 min of filtration: (a) unfiltered real water sample and (b) sand-filtered real water sample.
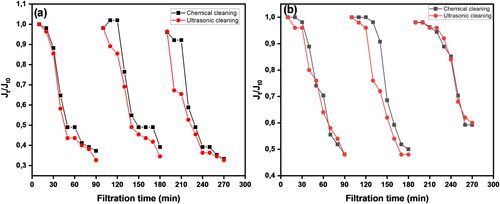
Table 6. Effect of membrane cleaning on flux recovery and reversible and irreversible fouling ratios using environmental water samples.
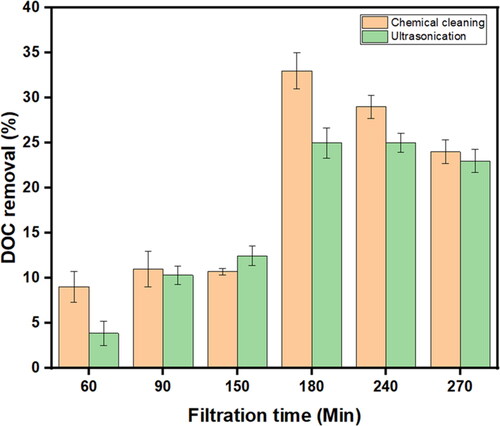
Figure 11. DOC removal efficiency from sand-filtered water after chemical cleaning and ultrasonication.