Figures & data
Figure 1. (Colour online) n16N chain sequence, labelled by putative character and function of hypothesised functional subdomain regions [Citation15]. Cationic and anionic residues are coloured in blue and red, respectively. An ellipsis indicates where the n16 parent protein’s chain continues.
![Figure 1. (Colour online) n16N chain sequence, labelled by putative character and function of hypothesised functional subdomain regions [Citation15]. Cationic and anionic residues are coloured in blue and red, respectively. An ellipsis indicates where the n16 parent protein’s chain continues.](/cms/asset/b1ec3184-1094-49fc-b473-3d33dd177909/gmos_a_1405158_f0001_oc.gif)
Table 1. Root-mean-square deviation (RMSD) values used for the geometric clustering analysis.
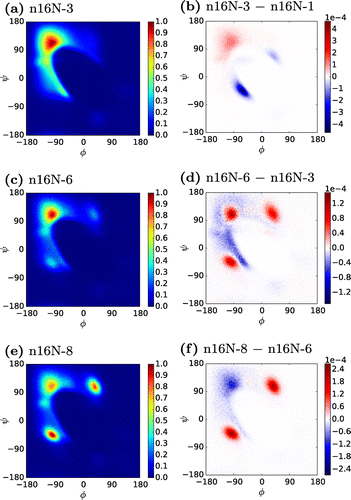
Figure 2. (Colour online) Ramachandran heat maps of n16N systems, accompanied by difference maps between neighbouring system sizes. In the difference maps, positive values are those more favoured in the larger system.

Figure 3. (Colour online) Most populated structural group of the n16N-8 system, comprising 17.5% of trajectory snapshots. Inset: Most populated structural group of the n16N-1 system, with 4.4% [Citation37].
![Figure 3. (Colour online) Most populated structural group of the n16N-8 system, comprising 17.5% of trajectory snapshots. Inset: Most populated structural group of the n16N-1 system, with 4.4% [Citation37].](/cms/asset/a7faac67-1476-42e2-b150-24869b0c0696/gmos_a_1405158_f0003_oc.gif)
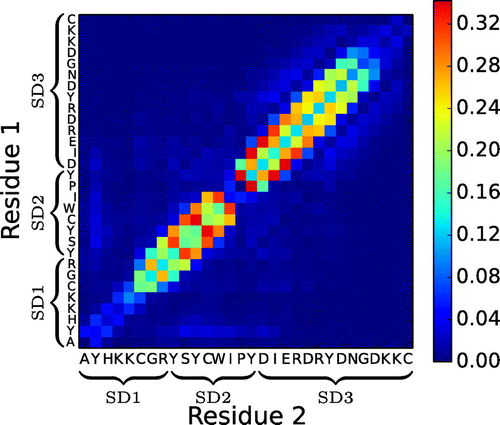
Figure 4. (Colour online) Average number of interpeptide hydrogen bonds per residue–residue pair in the n16N-8 system.

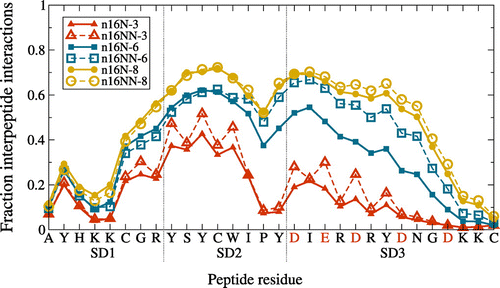
Figure 5. (Colour online) Average frequency of each n16N or n16NN residue being involved in aggregation-enabling interpeptide hydrogen bonds, at each system size. For the n16NN systems, the anionic residues indicated along the axis in red are replaced in n16NN according to D N and E
Q.

Table 2. Population of most populated clusters in full-system and subdomain clustering analyses, and discrete entropy of the configurational ensemble, providing an insight into the stability of the system or chain region compared to regions or systems of the same size.
