
Figures & data
Figure 1. (Colour online) Comparison of two trajectories between nnpairs and the analytical SPC/E model.
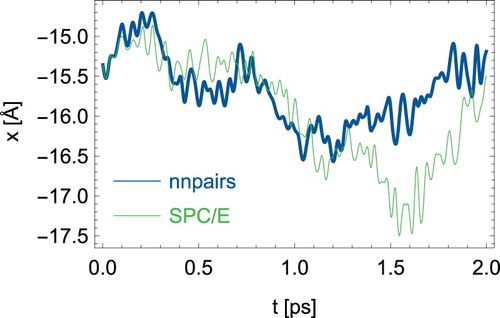
Figure 2. (Colour online) Radial distribution function between pairs of oxygen atoms for the neural network nnpairs model and the analytical SPC/E water model.
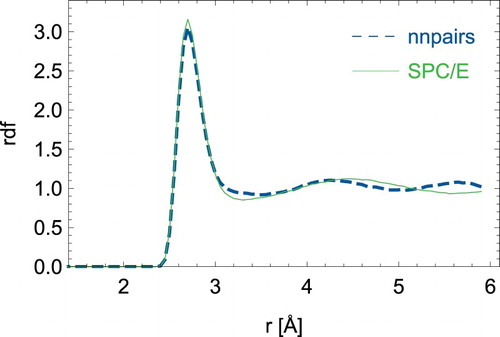
Figure 3. (Colour online) Radial distribution function between oxygen and hydrogen atoms for the neural network nnpairs model and the analytical SPC/E water model.
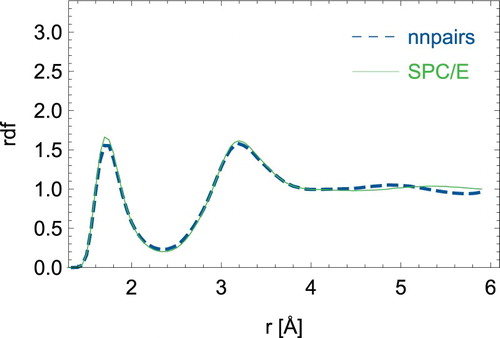
Figure 4. (Colour online) Velocity autocorrelation function of the H2O centre of mass velocities.
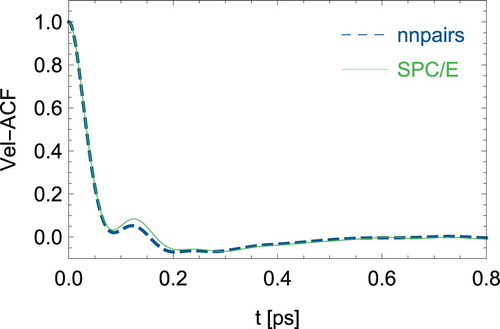
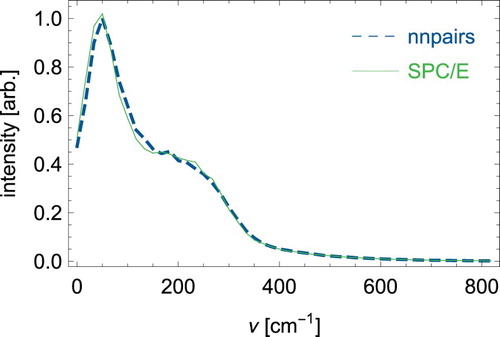
Figure 5. (Colour online) Power spectrum obtained from the velocity autocorrelation function of the H2O centre of mass velocities.
Supplemental material