
Figures & data
Figure 1. Workshop participants’ prior suturing experience (left pie chart), and type of suturing experience breakdown (right doughnut chart). W: workshop, H: hospital, Hm: home training.
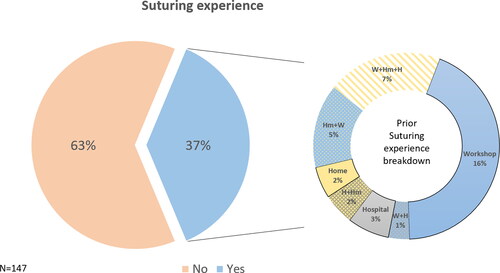
Table 1. demographic data.
Table 2. Workshop performance in relation to student characteristics.
Table 3. Multivariate analysis of student factors predicting a Rubric score ≥ 9.