Figures & data
TABLE 1 Ready Mix ingredients
TABLE 2 Typical chrysotile chemical composition (percent)
FIG. 1 Fiber aerosol generation and exposure system used for group 2, chrysotile. The fiber aerosol is generated using a rotating-brush-feed aerosol generator. Immediately following the generator, the airstream is passed though a cyclone to remove larger particles and fibers that would not be rat-respirable. The aerosol then passes through an Ni-63 charge neurtralizer and is then fed into the flow-past nose-only aerosol exposure system.
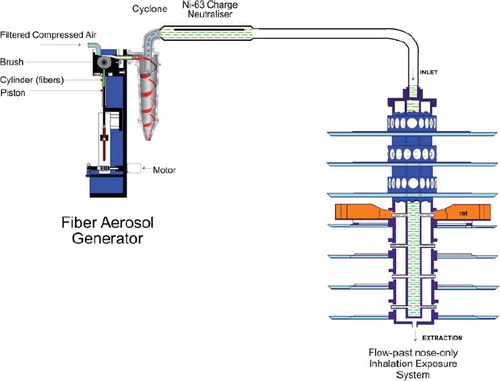
FIG. 2 Dual aerosol generators for fiber and powder generation and exposure system used for group 3, chrysotile and sanded material. The fiber generation system is identical to that described for . The powder aerosol (sanded material) is generated using a rotating-brush-feed aerosol generator. Immediately following the generator, the airstream is fed to an in-line micronizing system that assures that the aerosol is rat-respirable. The aerosol then passes through an Ni-63 charge neurtralizer. The two aerosol streams are mixed and the combined fiber and sanded material aerosol is then fed into the flow-past nose-only aerosol exposure system.
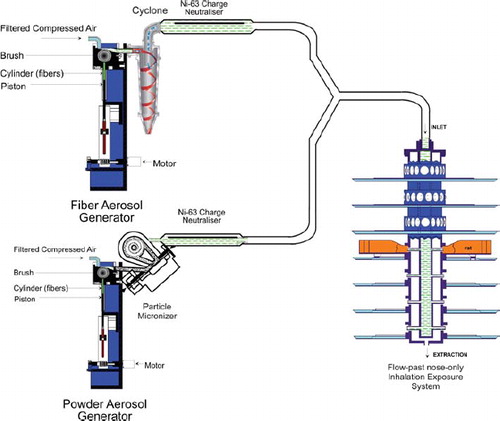
TABLE 3 The number, concentration, and size distribution of the chrysotile and chrysotile and powder exposure atmospheres
TABLE 4 Mean number of particlesa in the aerosol as evaluated by TEM
FIG. 3 SEM photomicrograph of one of the reserve aerosol sampling filters from exposure group 3 (chrysotile and sanded material). As can be seen, the particle/fiber loading of the filter was too dense to allow determination of the concentration; however, numerous particles of the sanded material are visible as well as the chrysotile fibers. The EDAX analysis of the particles/fibers in the center of the photomicrograph is shown in .
FIG. 4 EDAX analysis of the particles/fibers in the center of the photomicrograph in . The predominant peak is Ca from the calcium carbonate (limestone) in the sanded material. The Mg and Si are from the chrysotile. The smaller amounts of Fe, Cr, and K are also from the sanded material. The small amount of Al is probably from the sandpaper. The Au is used to coat the filter to permit SEM/EDAX analysis. It should be noted that while the Si, Mg, and Ca appear together in this spectra taken from the aerosol filter, in the actual aerosol, the sanded material (Ca) and the chrysotile (Si, Mg) are each generated independently and then mixed in the airstream (). Each aerosol stream was charge neutralized to Boltzmann equilibrium and from the time of mixing the combined aerosol is delivered to the rat's nose in approximately 3–4 s.
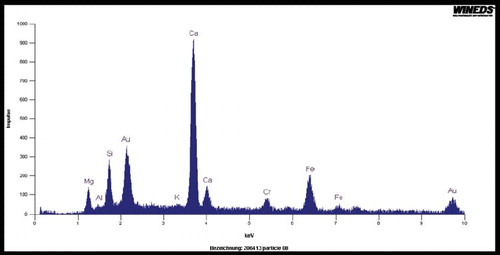
FIG. 5 Group 2, chrysotile aerosol, bivariate length and diameter distribution of each fiber and particle measured during the 5-day exposure.
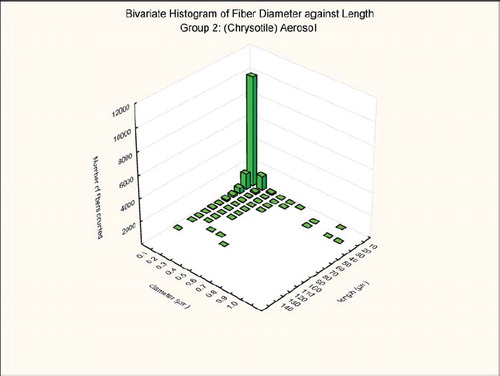
FIG. 6 Group 3, chrysotile and sanded component aerosol, bivariate length and diameter distribution of each fiber and particle measured during the 5-day exposure.
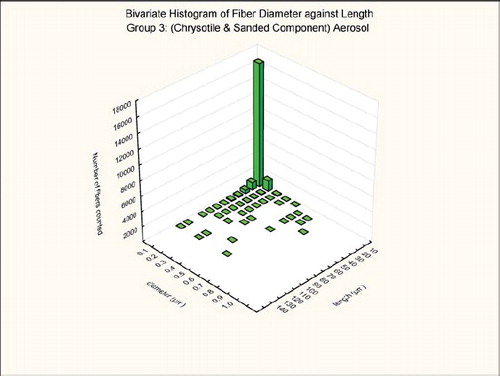
TABLE 5 Number, concentration, and size distribution of the chrysotile fibers in lungs of the rats from group 2, chrysotile exposure, and group 3, chrysotile and sanded component, immediately after the termination of the 5-day exposure (day 0)
TABLE 6 Number, concentration and size distribution of the chrysotile fibers in lungs of the rats from group 2, chrysotile exposure, and group 3, chrysotile and sanded component, at 3 days following cessation of exposure (day 3)
FIG. 7 Group 2, chrysotile, bivariate length and diameter distribution measured of fibers recovered from the rat's lungs immediately after cessation of the 5-day exposure.
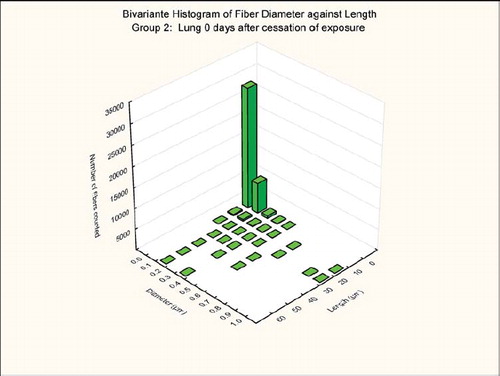
FIG. 8 Group 2, chrysotile bivariate length and diameter distribution measured of fibers recovered from the rat's lungs 3 days after cessation of the 5-day exposure.
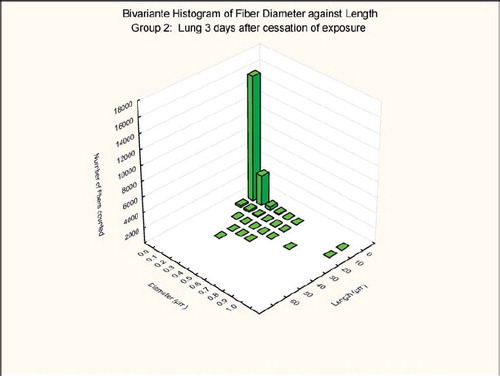
FIG. 9 Group 3, chrysotile and sanded material, bivariate length and diameter distribution measured of fibers recovered from the rat's lungs immediately after cessation of the 5-day exposure.
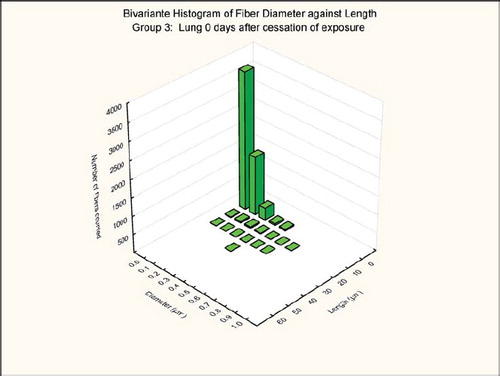
FIG. 10 Group 3, chrysotile and sanded material, bivariate length and diameter distribution measured of fibers recovered from the rat's lungs 3 days after cessation of the 5-day exposure.
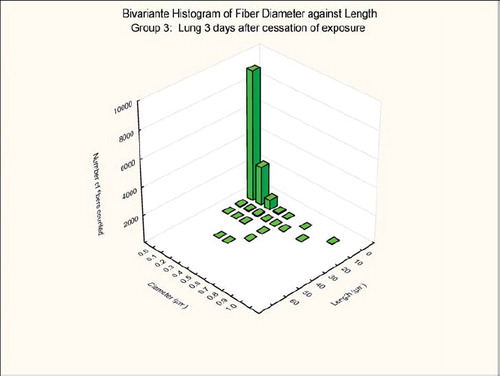
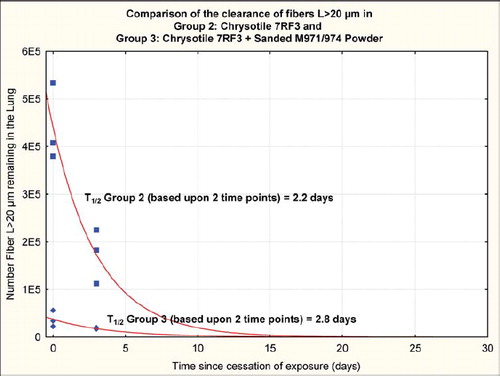
FIG. 11 Group 2, chrysotile, clearance half-time of fibers longer than 20 μ m of 2.2 days. It should be noted that these clearance half-times are based upon fitting an exponential clearance function to only two time points; however, they do provide a clear demonstration that the longer chrysotile fibers are rapidly disappearing from the lungs.
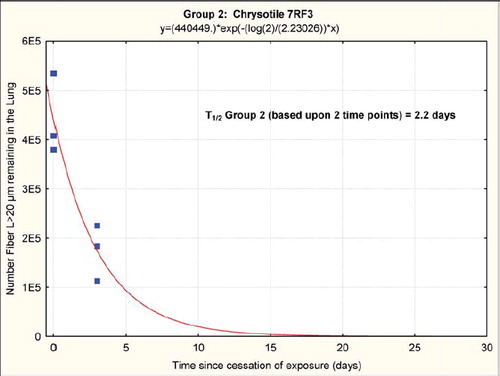
FIG. 12 Group 3, chrysotile and sanded component, clearance half-time of fibers longer than 20 μ m of 2.8 days. It should be noted that these clearance half-times are based upon fitting an exponential clearance function to only two time points; however, they do provide a clear demonstration that the longer chrysotile fibers are rapidly disappearing from the lungs.
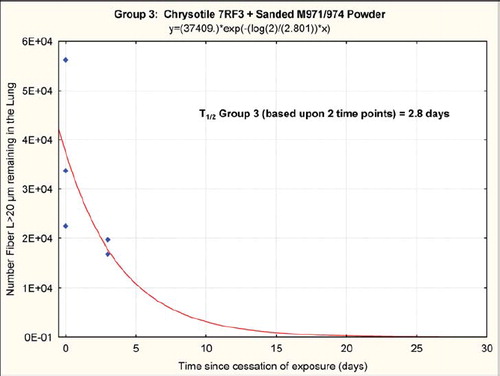
FIG. 13 Histopathological photo of control lung from a group 1 rat exposed to filtered air using a similar generator and exposure system (40× magnification). A few macrophages are seen.
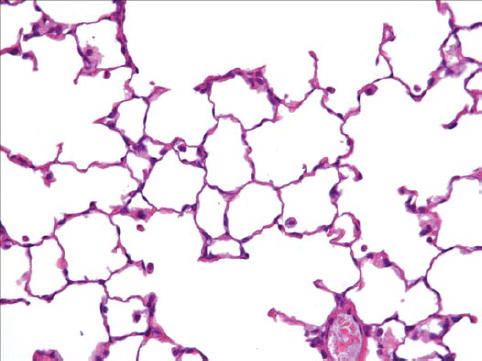
FIG. 14 Histopathological photo of lung from a group 2 rat exposed to chrysotile alone (40× magnification). A few macrophages are seen.
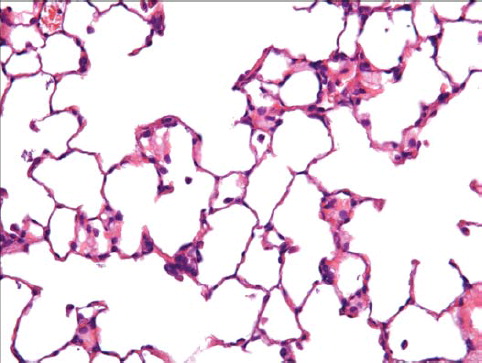
FIG. 15 Histopathological photo of lung from a group 3 rat exposed to chrysotile and the sanded component (40× magnification). An increased number of macrophages are observed with sometimes two or three per alveolus.
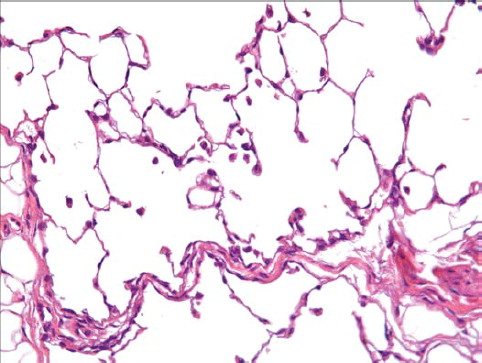
FIG. 16 Clearance curve from group 2 (chrysotile) and group 3 (chrysotile and sanded material).