
Figures & data
Figure 1. FAOSTAT estimation of global sugarcane crop biomass b-urned each year measuredaskilo tons of dry matter.
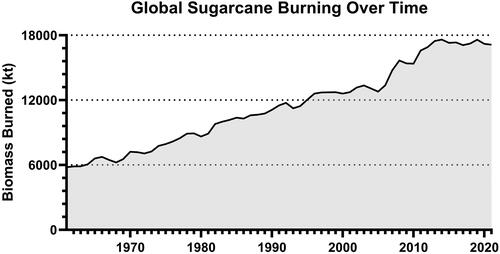
Figure 2. Photograph of burnt cane harvesters in Nicaragua demonstrating the high potential for ash inhalation.
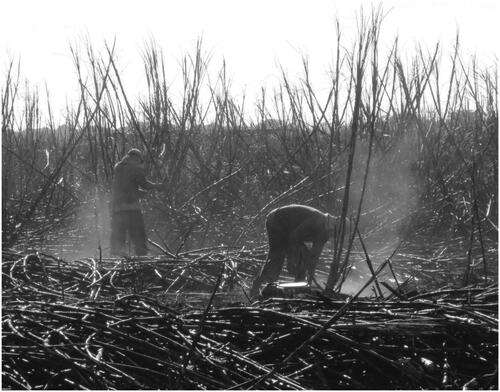
Figure 3. TEM Images of particles demonstrate the highly uniform nature of pristine manufactured SiNPs compared to the much more heterogeneous structure of environmentally relevant SiNPs derived from sugarcane ash.
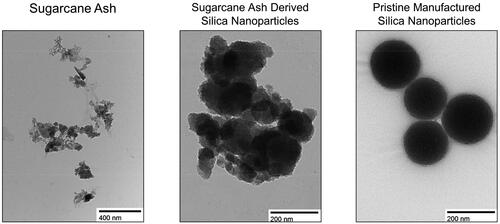
Figure 4. Potential exposure routes of silica nanoparticles and observed health effects.
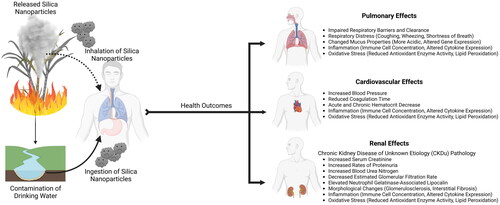
Figure 5. Hypothesized mechanism of SiNP-mediated kidney disease.
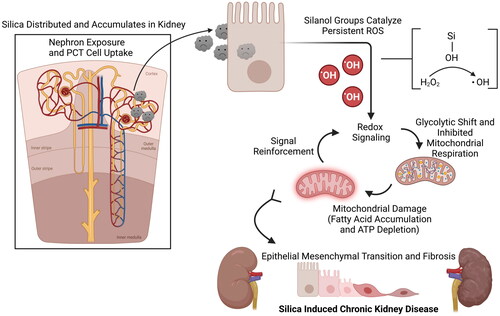
Table 1. Summary of primary literature investigating sugarcane fire emissions and key findings.
Table 2. Summary of silica characteristics and sources.
Data availability statement
There is no data associated with this manuscript.