Figures & data
Figure 1. Flow chart of the sample retrieval process.
Figure 2. Estimated average journal impact factor of meta-analyses that cited a study that had been retracted at least one year prior to their publication, partitioned by why the study was cited and whether it was included in the pooled estimate. Values are mean and 95% CI, derived from a regression model that controlled for the discipline of the journal. Similar results are obtained not controlling for discipline. “Probably included” refers to meta-analyses that appeared to have included the retracted study in their pooled summary, but did not provide primary data that would allow verification.
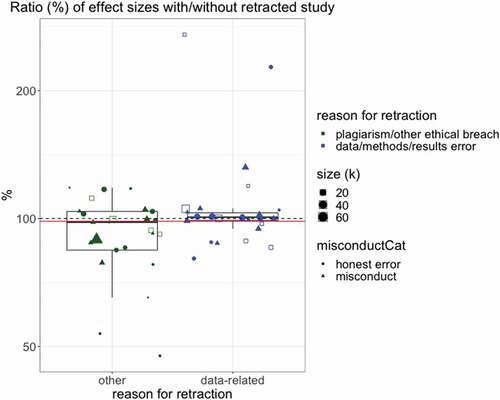
Figure 3. Relative size, in percentage, of meta-analytical pooled effect sizes calculated including and excluding the retracted study. Values of 100% (dashed line) indicate identical effect sizes, whereas values above 100% indicate that the meta-analysis with the retracted study yielded a larger effect size than without it. Empty squares indicate meta-analyses that included the same retracted study as another meta-analysis. Red line indicates the overall estimate.