Figures & data
Figure 1. Over-view of the two farrowing systems compared in the study. Picture A- TC-pen in which sows were temporarily confound at farrowing + movable heating lamp behind the sow. Picture B- TC-pen in which sows were loose 3 days after farrowing. Picture C- L-pen with loose sows at farrowing and during the whole lactation period.
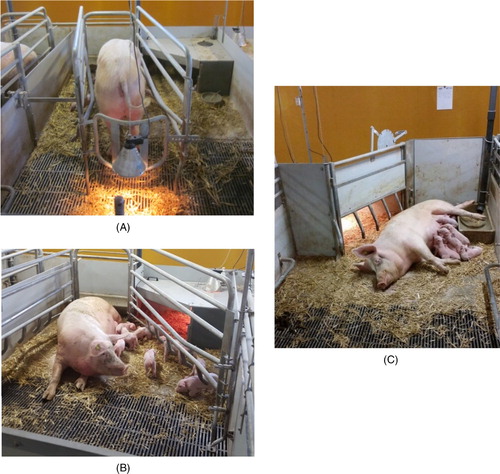
Table 1. Template used to classify causes of death of live-born piglets.
Table 2. Template used to classify morbidity/treatments in the sows.
Table 3. Template used to classify treatments/morbidity in the piglets.
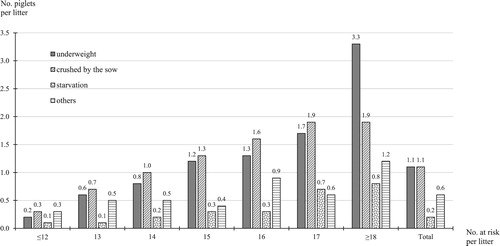
Figure 2. Number of dead piglets per litter within different litter sizes and with specified causes of death.