Figures & data
Table 1. Selected physical and chemical properties of the tested soil in the Taihu Lake Basin of Eastern China.
Table 2. Agricultural activities for the transplanted rice under multiple shallow irrigation in the Taihu Lake Basin of China.
Table 3. Nitrogen transformation parameters in soil used in the Hydrus-1D simulations in Lake Taihu Basin, China.
Table 4. Statistical indices (RMSE, E, d, and n) for assessing nitrogen (N) transport and transformation parameters using in Hydrus-1D simulations in the experimental transplanted rice field during the 2008 and 2009 seasons.
Figure 1. Simulated (Sim.) and observed (Obs.) and
concentrations in floodwater during the 2008 (a) and 2009 (b) seasons. P+I: precipitation and irrigation; BF: basal fertiliser; TF1 and TF2: topdressing fertiliser; the arrows at the top indicate fertiliser applications; DAB: days after basal fertiliser application.
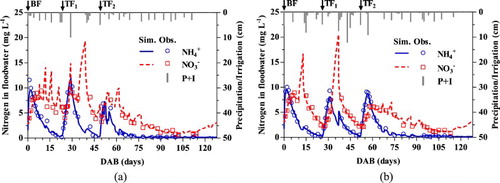
Figure 2. Simulated (Sim) and observed (Obs) ammonia volatilisation (AV) fluxes and simulated cumulative (Cum) AV fluxes during the 2008 (a) and 2009 (b) seasons. BF: basal fertiliser; TF1 and TF2: topdressing fertiliser; the arrows at the top indicate fertiliser applications; DAB: days after basal fertiliser application.
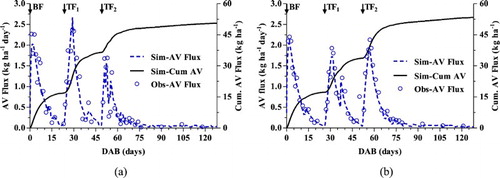
Figure 3. Simulated cumulative (Cum.) nitrogen uptake (,
, and total) and observed (Obs.) total nitrogen uptake during the 2008 (a) and 2009 (b) seasons. DAB: days after basal fertiliser application.
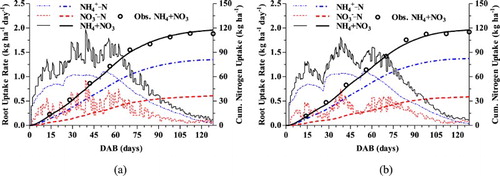
Figure 4. Comparison of simulated (Sim.) and observed (Obs.) (a, c) and
(b, d) concentrations at 20, 40, 60, and 80 cm depths during the 2008 (a, b) and 2009 (c, d) seasons. BF: basal fertiliser; TF1 and TF2: topdressing fertiliser; the arrows at the top indicate fertiliser applications; DAB: days after basal fertiliser application.
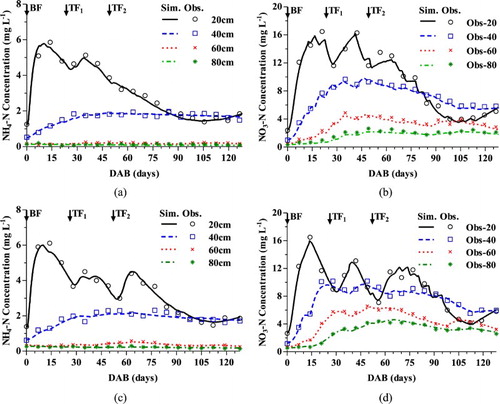
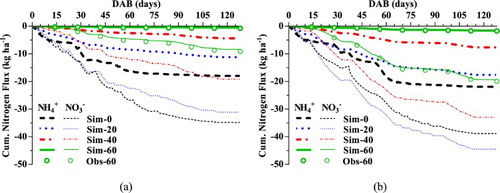
Figure 5. Simulated (Sim) cumulative nitrogen fluxes at 0, 20, 40, and 60 cm depths below the soil surface and observed (Obs) cumulative (Cum.) nitrogen fluxes at the 60 cm depth during the 2008 (a) and 2009 (b) seasons. DAB: days after basal fertiliser application.