Figures & data
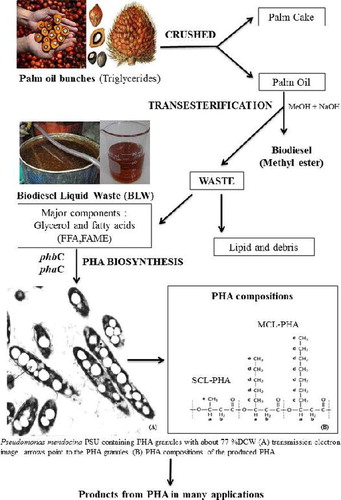
Fig. 1. Neighbour-joining phylogenetic tree constructed on the basis of the 16S rRNA gene sequence showing the phylogenetic relationships between Pseudomonas sp. PSU and its close relationship to other Pseudomonas species. The percentages of replicate trees in which the associated taxa were clustered together in the bootstrap test (1000 replicates) are shown next to the branches.
Table 1. Maximum cell growth, PHA production and PHA productivity produced from Pseudomonas mendocina PSU at various concentration of total glycerol in BLW.
Table 2. Maximum cell growth, PHA production and PHA productivity produced from Pseudomonas mendocina PSU from three different nitrogen sources.
Table 3. Predicted and experimental values of the responses at optimal conditions.
Fig. 2. Time profile of cell growth, PHA accumulation, alginate production and substrate utilization by Psuedomonas mendocina PSU grown with MSM supplemented with 20 g/L of total glycerol in BLW with a C/N of 40 at 35 °C and initial pH 7.0 (optimal conditions for PHA production obtained from RSM). Each data point represents a mean value of three independent experiments and a vertical bar represents the standard deviation.

Fig. 3. PCR analysis of the SCL-PHA synthase gene (phbC) and MCL-PHA synthase gene (phaC) in Pseudomonas sp. 100 pb ladder (lane 1, left) lane 2–4 primers for phbC amplification were used24 whereas lane 5–7 primers for phaC amplification were used25,26 lane 2 and lane 5; Pseudomonas mendocina PSU against control e.g. Pseudomonas sp. USM 4-55 (lane 3 and lane 6) and negative control e.g. Burkholderia sp. USM (lane 4 and lane 7).
Fig. 4. 1H-NMR spectrum of PHA produced from Pseudomonas mendocina PSU when grown with BLW and a schematic structure of the PHA.