
Figures & data
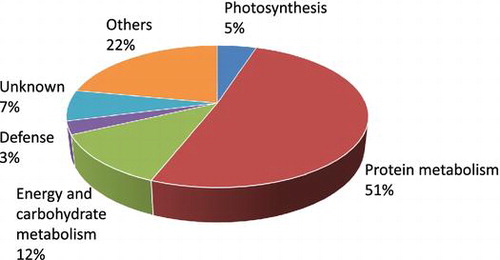
Fig. 1. Effects of OPDA on protonema prolongation in P. patens.
Notes: Protonemata were grown on BCDATG agar plates with OPDA or JA for four days. The control showed protonemata on the agar plate without OPDA and JA. Scale bar shows 200 μm.
Fig. 2. Accumulation of OPDA in P. patens protonemata after mechanical stress.
Notes: P. patens protonemata were grown on BCDATG agar medium for four days, and the concentration of endogenous OPDA was analyzed. After P. patens protonemata were subjected to mechanical stress for the indicated times, the protonemata were harvested and the OPDA concentration was analyzed using UPLC-MS/MS. The values are the means ± SD (n = 4). Student’s t test, *p < 0.05, **p < 0.01, ***p < 0.001.
Table 1. Proteins identified as responsive to OPDA in P. patens protonemata.
Fig. 3. Comparison of proteins changed in gametophore and protonema.
Notes: A: comparison of the global protein response to OPDA; B: comparison of proteins increased by OPDA; C: comparison of proteins decreased by OPDA. PH: photosynthesis; PR: protein metabolism (protein synthesis, folding and degradation); EM: energy and carbohydrate metabolism; DE: defense; UK: unknown. Gametophore data are derived from a paper by Toshima et al.Citation19)
Fig. 4. Relative expression of histone genes by qRT-PCR.
Notes: Five-day-old P. patens protonemata were treated with 10 µM OPDA or water for 24 h. The expression level of the internal standard gene actin is set to 1.0. The data represent means ± SD (n = 3). Asterisks represent significant differences between OPDA-treated plants and control plants (Student’s t test, *p < 0.05). histone A: Pp1s117_154V6.1; histone B: Pp1s219_44V6.1; histone C: Pp1s376_22V6.1; histone D: Pp1s46_245V6.1; histone E: Pp1s72_85V6.1; histone F: Pp1s72_86V6.1.
Supplemental material