Figures & data
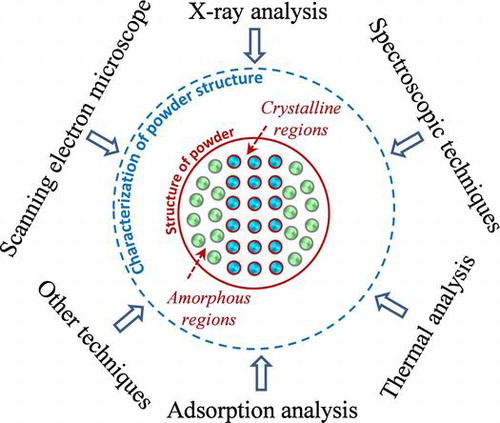
Fig. 1. An illustration of molecular arrangement in crystalline, amorphous and mixed structural powders (Adapted from Bhandari and RoosCitation19)).
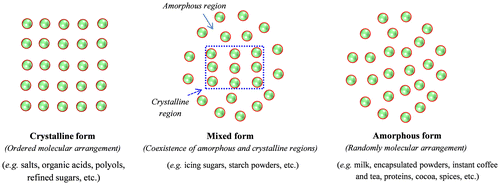
Table 1. Differences about structure and properties of amorphous and crystalline food powders.
Fig. 2 Sketch of solid encapsulation using amorphous cyclodextrin powders.
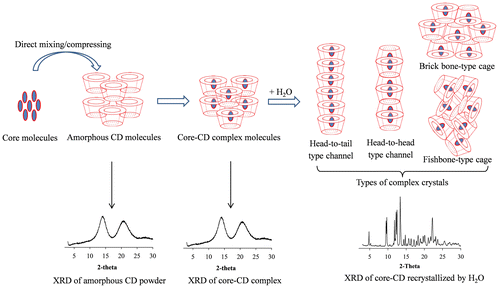
Fig. 3. XRD (a) and SEM (b) of amorphous and crystalline α-cyclodextrin powders (adapted from Ho et al.Citation16)).
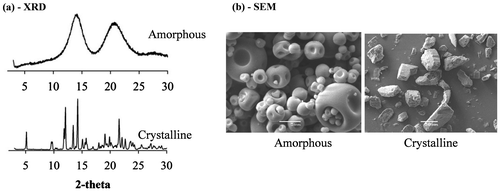
Fig. 4. Typical curves of conventional DSC for amorphous and crystalline powders scanned with open and closed pans.
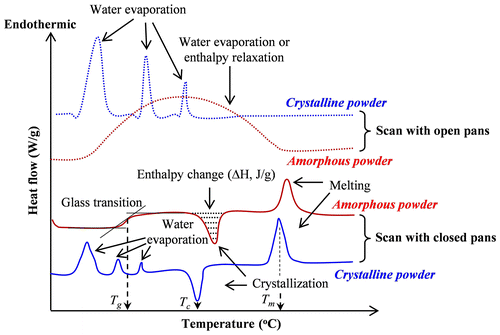
Fig. 5. Typical water adsorption isotherm of amorphous and crystalline powders determined by the gravimetric vapor sorption; (*) aw = RH/100 as the stored powders achieve a moisture equilibrium with surrounding environment.
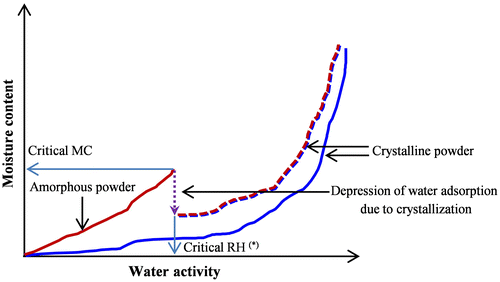
Table 2. A comparison on static and dynamic water adsorption techniques.
Fig. 6. The electromagnetic radiation region applied in various spectroscopic techniques (Adapted from TadayCitation125).
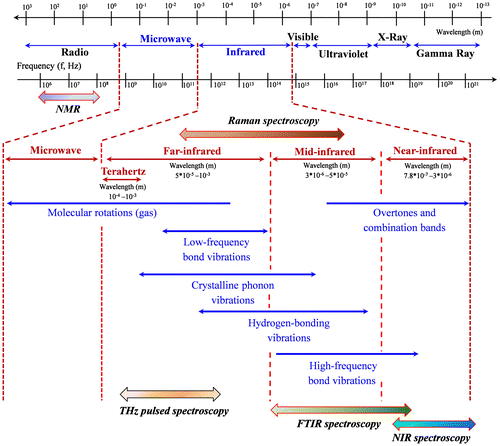
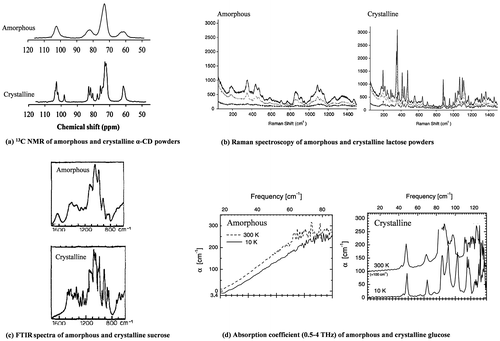
Fig. 7. Differences between amorphous and crystalline powder under various analytical techniques: (a) 13C NMR of amorphous and crystalline α-CD powders (adapted from Ho et al. Citation16)); (b) Raman spectroscopy of amorphous and crystalline lactose powders (adapted from Murphy et al. Citation146); (c) FTIR spectra of amorphous and crystalline sucrose (adapted from Mathlouthi and CholliCitation160); and (d) Absorption coefficient (0.5–4 THz) of amorphous and crystalline glucose (Adapted from Walther et al. Citation168)).