Figures & data
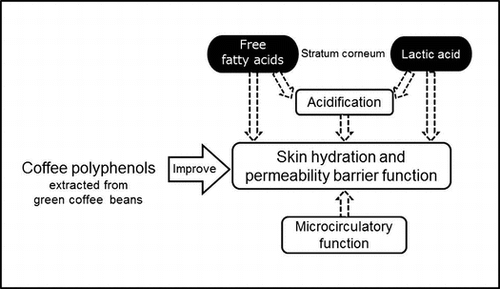
Fig. 1. The effects of CPPs on the dryness score of the lower cheeks (a) and the hands (b). The values are the means ± S.E. of the placebo group (n = 26) and the CPP group (n = 23). †† p < 0.01 vs. Week 0 (0 w) (Dunnett’s test).
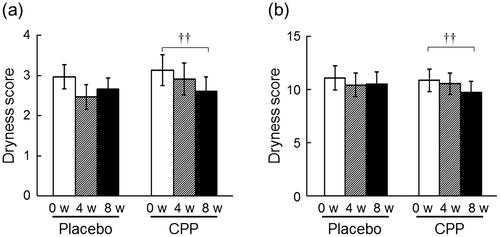
Fig. 2. The effects of CPPs on TEWL of the lower cheek (a) and the back of the hand (c). The percentage change in TEWL of the lower cheek (b) and back of the hand (d) after 8 weeks of ingestion. The values are the means ± S.E. of the placebo group (n = 26) and the CPP group (n = 23). †† p < 0.01, ††† p < 0.001 vs. 0 w (Dunnett’s test). ## p < 0.01 vs. the placebo group (two-way repeated measures ANOVA). * p < 0.05, *** p < 0.001 vs. the placebo group (Student’s t-test).
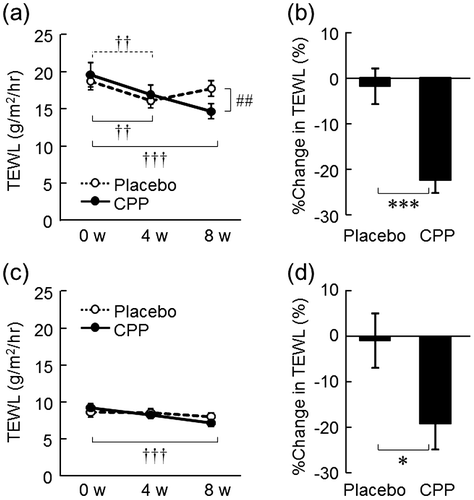
Fig. 3. The effects of CPPs on skin hydration of the lower cheek (a) and the back of the hand (c). The percentage change in capacitance of the lower cheek (b) and the back of the hand (d) after 8 weeks of ingestion. The values are the means ± S.E. of the placebo group (n = 26) and the CPP group (n = 23). ††† p < 0.001 vs. 0 w (Dunnett’s test). ### p < 0.001 vs. the placebo group (two-way repeated measures ANOVA). * p < 0.05, *** p < 0.001 vs. the placebo group (Student’s t-test).
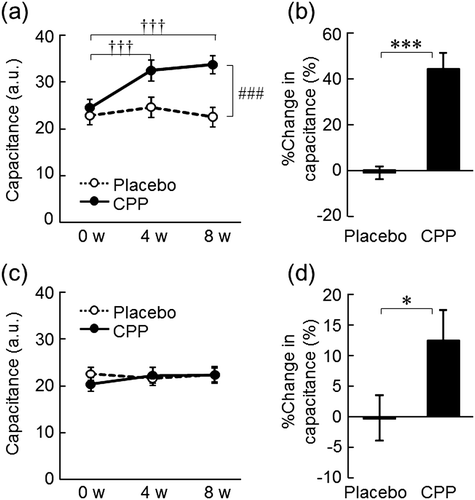
Fig. 4. The effects of CPPs on pH of the lower cheek (a) and the back of the hand (c). The percentage change in pH of the lower cheek (b) and the back of the hand (d) after 8 weeks of ingestion. The values are the means ± S.E. of the placebo group (n = 26) and the CPP group (n = 23). † p < 0.05 vs. 0 w (Dunnett’s test). # p < 0.05 vs. the placebo group (two-way repeated measures ANOVA).
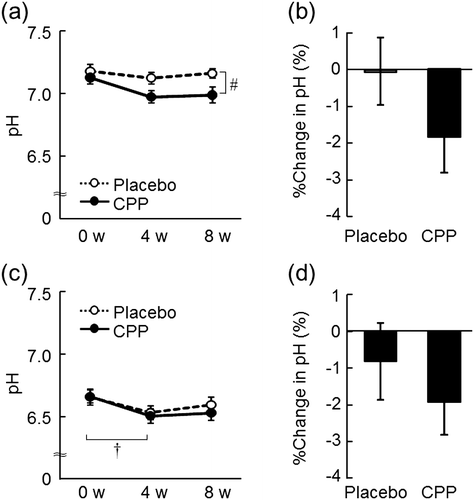
Fig. 5. The effects of CPPs on FFAs (total amount of C20-C30 FFAs) (a) and lactic acid (b) in the stratum corneum of the lower cheek. The values are the means ± S.E. of the placebo group (n = 26) and the CPP group (n = 23). † p < 0.05, ††† p < 0.001 vs. 0 w (paired t-test). # p < 0.05 vs. the placebo group (two-way repeated measures ANOVA). FFAs; free fatty acids.
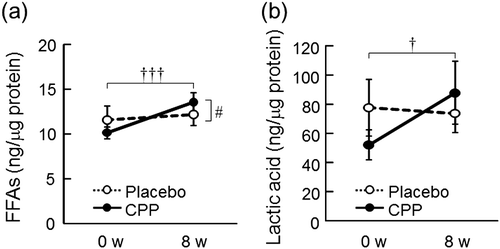
Table 1. The effects of CPPs on components in the stratum corneum of the lower cheek.
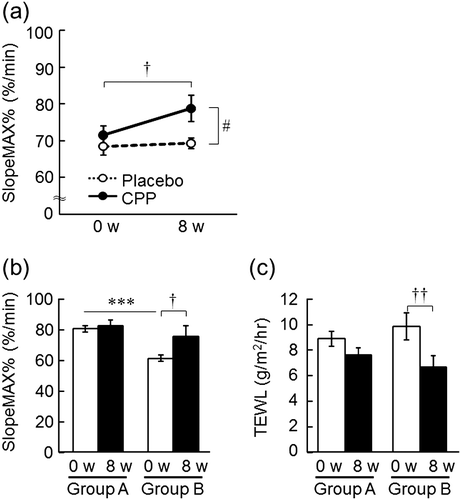
Fig. 6. The effects of CPPs on the responsiveness of SkBF during local warming (a). The effects of the difference of initial responsiveness of SkBF on the efficacy of CPPs: SlopeMAX% of the forearm (b) and TEWL of the back of the hand (c). The values are the means ± S.E. of the placebo group (n = 24) and the CPP group (n = 21) (a); Group A (n = 12) and Group B (n = 9) (b, c). † p < 0.05, †† p < 0.01 vs. 0 w (paired t-test). # p < 0.05 vs. the placebo group (two-way repeated measures ANOVA). *** p < 0.001 vs. Group A (Student’s t-test). SkBF; skin blood flow.