744
Views
6
CrossRef citations to date
0
Altmetric
Biochemistry & Molecular Biology

Amelioration of diabetic nephropathy by oral administration of d-α-tocopherol and its mechanisms

, , , &
Pages 65-73 | Received 18 Jul 2017, Accepted 13 Nov 2017, Published online: 03 Jan 2018

Figures & data

Figure 1. Effects of the oral administration of αToc on blood glucose levels and body weight. The blood glucose levels (A) and body weight (B) of the mice in each group were measured before and after STZ administration (day 0 and day 5) and every week thereafter for 6 weeks. Number of mice in every group was n = 5. The values are means ± SE. The results of two way ANOVA were shown as a table in graphs. Different superscript letters indicate significant difference analyzed with two way ANOVA and Scheffe’s test among the groups.
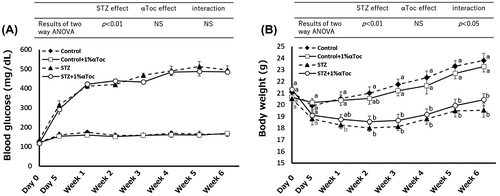
Figure 1. Effects of the oral administration of αToc on blood glucose levels and body weight. The blood glucose levels (A) and body weight (B) of the mice in each group were measured before and after STZ administration (day 0 and day 5) and every week thereafter for 6 weeks. Number of mice in every group was n = 5. The values are means ± SE. The results of two way ANOVA were shown as a table in graphs. Different superscript letters indicate significant difference analyzed with two way ANOVA and Scheffe’s test among the groups.
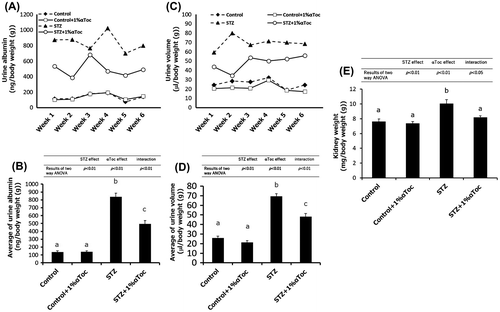
Figure 2. Changes in the symptoms of DN due to the oral administration of αToc. (A) Urine albumin levels were measured in each group from weeks 1 to 6. (B) The mean amounts of urine albumin from weeks 1 to 6 are shown. Urine albumin levels were normalized to body weights of the mice. (C) Urine volume was measured for each group using metabolic cages. (D) The mean volumes of urine from weeks 1 to 6 are shown. Urine volumes were normalized to the body weights of the mice. (E) Kidney weights were measured at end of the experiment (week 6) and normalized to the body weights. The error bars show ± SE. The results of two way ANOVA were shown as a table in graphs. Different superscript letters indicate significant difference analyzed with two way ANOVA and Scheffe’s test among the groups.
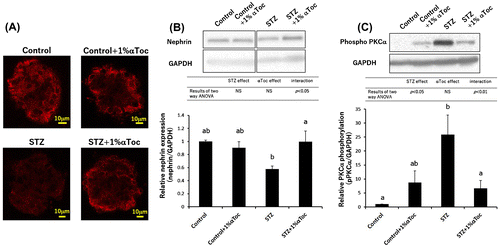
Figure 2. Changes in the symptoms of DN due to the oral administration of αToc. (A) Urine albumin levels were measured in each group from weeks 1 to 6. (B) The mean amounts of urine albumin from weeks 1 to 6 are shown. Urine albumin levels were normalized to body weights of the mice. (C) Urine volume was measured for each group using metabolic cages. (D) The mean volumes of urine from weeks 1 to 6 are shown. Urine volumes were normalized to the body weights of the mice. (E) Kidney weights were measured at end of the experiment (week 6) and normalized to the body weights. The error bars show ± SE. The results of two way ANOVA were shown as a table in graphs. Different superscript letters indicate significant difference analyzed with two way ANOVA and Scheffe’s test among the groups.
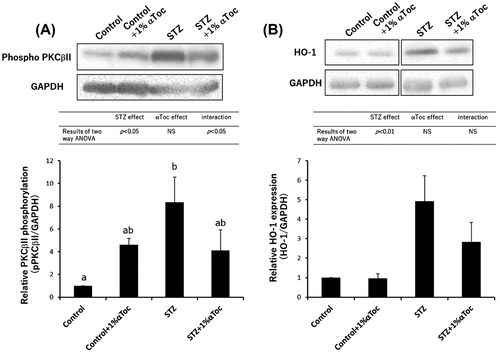
Figure 3. Effects of the oral administration of αToc on podocyte loss and the phosphorylation of PKCα in DN. The kidneys of the mice were removed at the end of the experiment (week 6) and were sectioned. We performed immunofluorescent staining of these sections using an anti-nephrin antibody for the primary antibody. The nephrin staining (red) was observed using confocal laser microscopy (A). The kidneys removed at the end of experiment (week 6) were lysed and subjected to SDS-PAGE followed by Western blotting using anti-nephrin antibody (B) and anti-PKCα (phospho S657) antibody (C). The intensities of nephrin and phospho-PKCα were analyzed with ImageJ and normalized to that of GAPDH. The values are means ± SE. The results of two way ANOVA were shown as a table in graphs. Different superscript letters indicate significant difference analyzed with two way ANOVA and Scheffe’s test among the groups.

Figure 3. Effects of the oral administration of αToc on podocyte loss and the phosphorylation of PKCα in DN. The kidneys of the mice were removed at the end of the experiment (week 6) and were sectioned. We performed immunofluorescent staining of these sections using an anti-nephrin antibody for the primary antibody. The nephrin staining (red) was observed using confocal laser microscopy (A). The kidneys removed at the end of experiment (week 6) were lysed and subjected to SDS-PAGE followed by Western blotting using anti-nephrin antibody (B) and anti-PKCα (phospho S657) antibody (C). The intensities of nephrin and phospho-PKCα were analyzed with ImageJ and normalized to that of GAPDH. The values are means ± SE. The results of two way ANOVA were shown as a table in graphs. Different superscript letters indicate significant difference analyzed with two way ANOVA and Scheffe’s test among the groups.

Figure 4. Changes in the level of phospho-PKCβII and HO-1 expression in the kidneys. The kidneys were removed at the end of the experiment (week 6) and were lysed and subjected to SDS-PAGE followed by Western blotting using anti-PKC (phospho S660) antibody (A) and anti-HO-1 antibody (B). The intensities were analyzed with ImageJ and normalized to that of GAPDH. The values are means ± SE. The results of two way ANOVA were shown as a table in graphs. Different superscript letters indicate significant difference analyzed with two way ANOVA and Scheffe’s test among the groups.

Figure 4. Changes in the level of phospho-PKCβII and HO-1 expression in the kidneys. The kidneys were removed at the end of the experiment (week 6) and were lysed and subjected to SDS-PAGE followed by Western blotting using anti-PKC (phospho S660) antibody (A) and anti-HO-1 antibody (B). The intensities were analyzed with ImageJ and normalized to that of GAPDH. The values are means ± SE. The results of two way ANOVA were shown as a table in graphs. Different superscript letters indicate significant difference analyzed with two way ANOVA and Scheffe’s test among the groups.

Figure 5. Effects of the oral administration of low-concentration αToc on DN. The blood glucose levels (A) and body weights (B) of the mice in each group were measured before and after STZ administration (day 0 and day 5) and at every week thereafter until 3 weeks. The mean urine albumin amount (C) and urine volume (D) from weeks 1 to 3 are shown. The values are means ± SE. Asterisks show significance compared with STZ group (p < 0.05; Dunnett’s multiple comparison test).
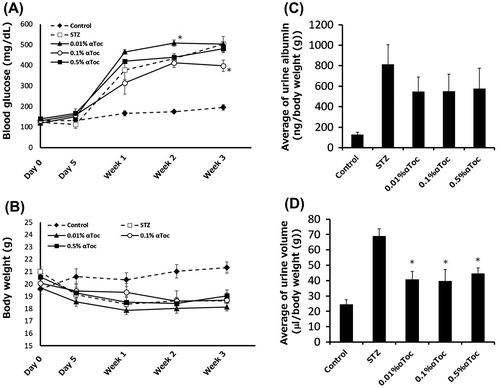
Figure 5. Effects of the oral administration of low-concentration αToc on DN. The blood glucose levels (A) and body weights (B) of the mice in each group were measured before and after STZ administration (day 0 and day 5) and at every week thereafter until 3 weeks. The mean urine albumin amount (C) and urine volume (D) from weeks 1 to 3 are shown. The values are means ± SE. Asterisks show significance compared with STZ group (p < 0.05; Dunnett’s multiple comparison test).
Supplemental material

Reprints and Corporate Permissions

Please note: Selecting permissions does not provide access to the full text of the article, please see our help page How do I view content?

To request a reprint or corporate permissions for this article, please click on the relevant link below:

Academic Permissions

Please note: Selecting permissions does not provide access to the full text of the article, please see our help page How do I view content?

Obtain permissions instantly via Rightslink by clicking on the button below:

If you are unable to obtain permissions via Rightslink, please complete and submit this Permissions form. For more information, please visit our Permissions help page.