Figures & data
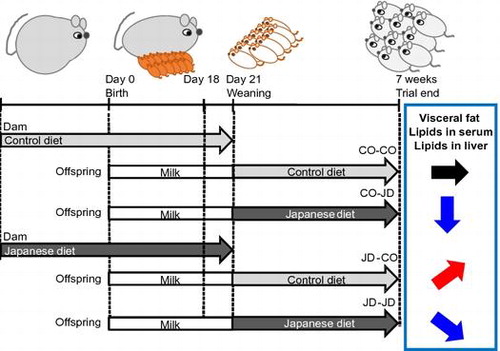
Table 1. Menu card of 1975 Japanese diet.
Figure 1. Study protocol. Dams were given the Control diet or the Japanese diet during pregnancy and lactation and offspring from each group was divided into two groups given the Control diet or 1975 Japanese diet after weaning at 3 weeks.
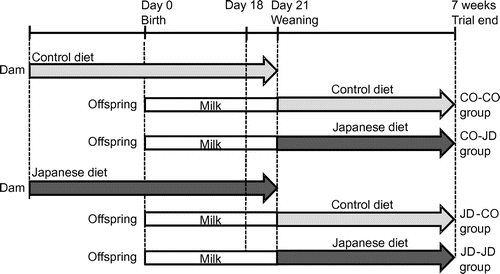
Table 2. Primer pairs used for the quantitative RT-PCR analysis.
Table 3. Nutritional compositions of test diets.
Table 4. Growth parameters.
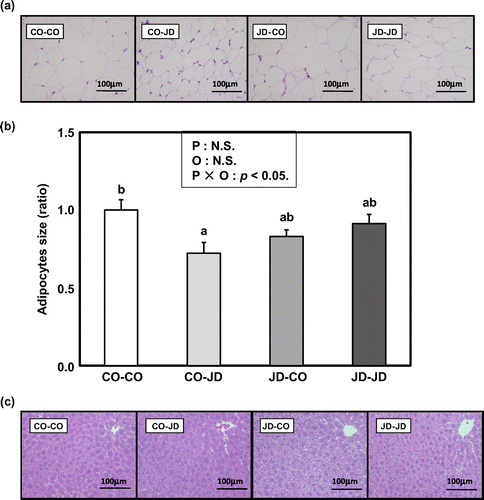
Figure 2. Effects of the Japanese diet intake from pregnancy and lactation on adipocytes and liver of offspring at 7 weeks. (a) Effects of the Japanese diet intake from pregnancy and lactation on adipocytes of offspring at 7 weeks. Photographs were hematoxylin-eosin staining of epididymal adipose tissue sections from representative mice of each group (scale bar = 100 μm). (b) Bar graph of the adipocytes size ratio of the CO-CO, CO-JD, JD-CO and JD-JD groups. Statistical analysis was performed using one-way ANOVA and two-way ANOVA followed by Tukey-Kramer’s test. Different superscript letters indicate significantly different means at p < 0.05. Maternal diet effect, Post-weaning diet effect and interaction were described at the top of the graph: P, Maternal diet effect; O, post-weaning diet effect; P × O, interaction. (c) Effects of the Japanese diet intake from pregnancy and lactation on liver of offspring at 7 weeks. Photographs were hematoxylin-eosin staining of liver sections from representative mice of each group (scale bar = 100 μm).