Figures & data

Figure 1. Schematic diagram of ethylene biosynthesis with the enzymes that synthesize or oxidase 1-aminocyclopropane-1-carboxylic acid (ACC) to produce ethylene. The chemical and biological effectors showing different points of inhibition or decomposition of the ethylene synthesis intermediate are highlighted by gray squares. Met, L-methionine; SAM, S-adenosyl-L-methionine, AVG, aminoethoxyvinylglycine; AgNO3, silver nitrate; α-KB, α-ketobutyrate.
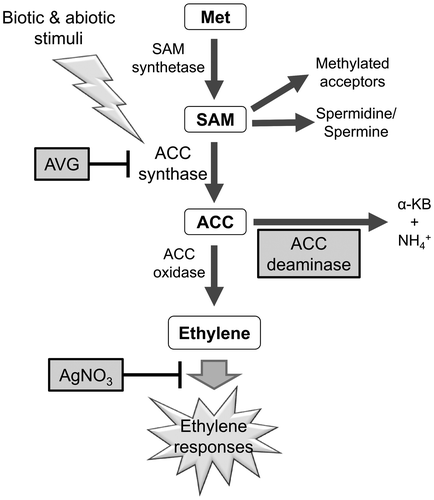
Figure 2. Effects of different ethylene inhibitors on the ethylene evolution from cotyledon explants inoculated with an Agrobacterium strain EHA105 harboring a binary vector pIG121-Hm. Accumulation of ethylene gas in the headspace of culture vials after varying days after inoculation (DAI) was measured using a gas chromatography. Non-inoculated, explants were not inoculated with Agrobacterium; No inhibitor, no ethylene inhibitors was used for transformation, AgNO3, silver nitrate was included in the media; AVG, aminoethoxyvinlyglycine was included in the media; pBBRcont, pBBR control vector was co-integrated in the Agrobacterium; pBBRacds, pBBRacds vector that contained ACC deaminase gene was co-integrated in the Agrobacterium. Data are the averages and SD of three vials for each treatment, in which three explants were incubated in each vial. Letters on top of the bars indicate statistical significance at the 95% confidence level based on Duncan’s mean comparison.
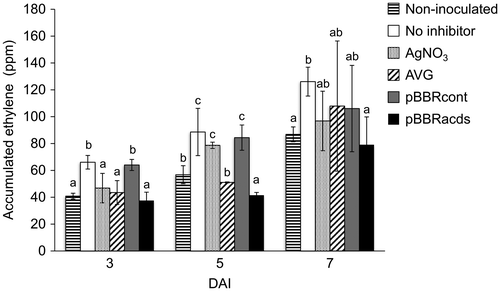
Figure 3. Histochemical GUS staining of watermelon cotyledon explants inoculated with an Agrobacterium strain EHA105 harboring pIG121-Hm binary vector. The horizontal axis represents different ethylene inhibitors as in the legend of Figure 2. Representative images of explants after varying DAI were shown.
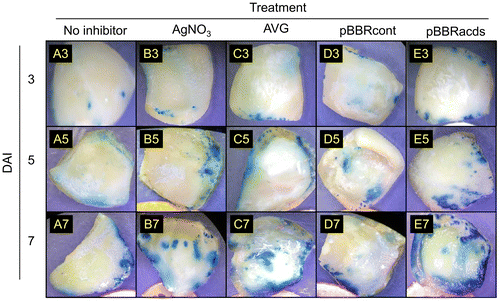
Figure 4. Quantification of leaf surface areas that showed GUS transgene expression on the cotyledonary explants of wild watermelon in the presence of different ethylene inhibitors. Values at varying DAI are shown. The ImageJ software was used to quantify the areas of blue stains on the explants. Nomenclature of the different ethylene inhibitors is the same as in Figure 2. Data are the average ± SD of 30 explants. Letters on top of the bars indicate statistical significance at the 95% confidence level based on Duncan’s mean comparison.
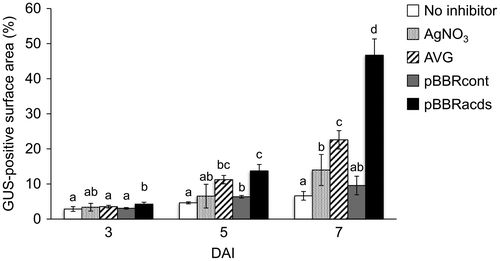
Figure 5. Spectrophotometric GUS enzyme assay using the total protein extracts from watermelon explants inoculated with Agrobacterium containing pIG121-Hm that were treated with different ethylene inhibitors. A total of 10 explants per treatment were harvested at 7 DAI, then protein extracts were independently prepared from individual explants and used for the enzyme assay. Nomenclature of the different ethylene inhibitors is the same as Figure 2. The 4-nitrophenyl β-D-glucuronide was used as a substrate. Enzyme activities were expressed as nmol of nitrophenyl produced per min per gram fresh weight of the explants. Data are average ± SD of ten explants. Letters on top of the bars indicate statistical significance at the 95% confidence level based on Duncan’s mean comparison.
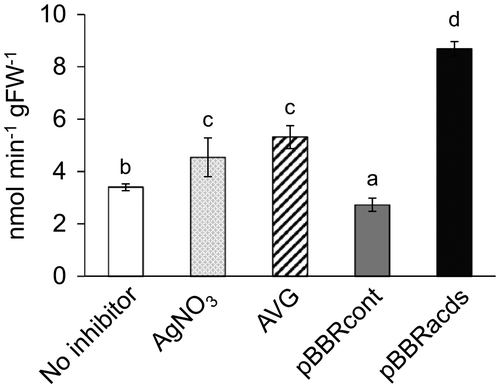
Table 1. Effects of different ethylene inhibitors on transgenic shoot formation in wild watermelon.
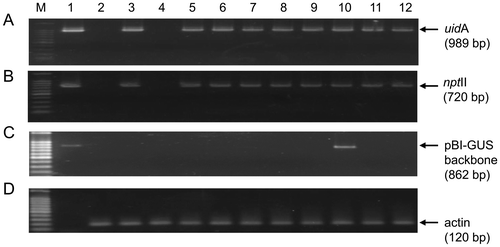
Figure 6. PCR amplification of the transgene fragments from transformed shoots of watermelon under different ethylene inhibitors. Genome DNAs were extracted from the randomly selected shoots and used as templates for amplifying fragments of (A) uidA 989 bp, (B) the nptII 720 bp transgenes, (C) a 862 bp region of pIG121-Hm backbone outside of T-DNA borders, and (D) endogenous wild watermelon actin as reference gene to check the intactness of the DNA. The amplified fragments (A, B, C) are segments in the pIG121-Hm reporter plasmid used in the experiment for monitoring the gene transfer. Lane M, DNA size marker; 1, pIG121-Hm plasmid DNA as positive control template; 2, non-transformed wild watermelon leaf disk; 3–12, genomic DNAs extracted from regenerated shoots treated with different inhibitors (3–4, no effector; 5–6, AgNO3; 7–8, AVG; 9–10, pBBRcont; 11–12, pBBRacds).