890
Views
66
CrossRef citations to date
0
Altmetric
Biochemistry & Molecular Biology

Silencing of lncRNA ZFAS1 inhibits malignancies by blocking Wnt/β-catenin signaling in gastric cancer cells

, , , , &
Pages 456-465 | Received 30 Nov 2017, Accepted 16 Jan 2018, Published online: 09 Feb 2018

Figures & data

Table 1. Sequence information of real-time PCR primers used in this study.

Table 2. Information of lncRNA ZFAS1 knockdown sequences.

Figure 1. Silencing of lncRNA ZFAS1 inhibited the proliferation and cell cycle process in gastric cancer cells. (A) The expression level of ZFAS1 in gastric cancer specimens and paired para-carcinoma tissues was detected by real-time PCR. (B) The expression level of ZFAS1 in SGC7901 cells with or without ZFAS1 knockdown. (C) The viability of SGC7901 cells was detected by CCK-8 assay (the data were compared with NC group). (D) The expression level of PCNA in SGC7901 cells was detected by western blot. (E) The percentage of SGC7901 cells in each phase. (F) The PI of SGC7901 cells (PI=(S + G2/M)/G1). (G, H) The expression levels of Cyclin D1, Cyclin E and Cyclin B1 in SGC7901 cells were detected by western blot. (*p < 0.05, **p < 0.01, ***p < 0.001, ns, no significance; ZFAS1, zinc finger antisense 1; PCNA, proliferating cell nuclear antigen; PI, proliferation index).
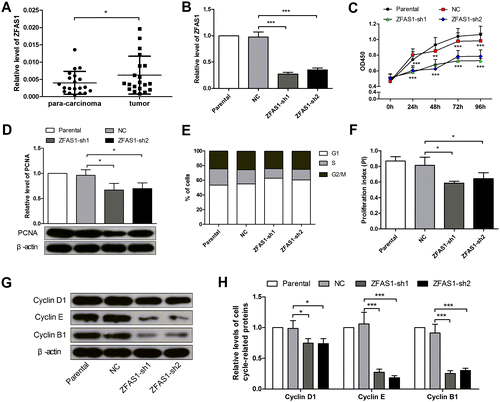
Figure 1. Silencing of lncRNA ZFAS1 inhibited the proliferation and cell cycle process in gastric cancer cells. (A) The expression level of ZFAS1 in gastric cancer specimens and paired para-carcinoma tissues was detected by real-time PCR. (B) The expression level of ZFAS1 in SGC7901 cells with or without ZFAS1 knockdown. (C) The viability of SGC7901 cells was detected by CCK-8 assay (the data were compared with NC group). (D) The expression level of PCNA in SGC7901 cells was detected by western blot. (E) The percentage of SGC7901 cells in each phase. (F) The PI of SGC7901 cells (PI=(S + G2/M)/G1). (G, H) The expression levels of Cyclin D1, Cyclin E and Cyclin B1 in SGC7901 cells were detected by western blot. (*p < 0.05, **p < 0.01, ***p < 0.001, ns, no significance; ZFAS1, zinc finger antisense 1; PCNA, proliferating cell nuclear antigen; PI, proliferation index).

Figure 2. Knockdown of ZFAS1 suppressed the migration, invasion and EMT in gastric cancer cells. (A) The transwell assay images of SGC7901 cells with or without ZFAS1 knockdown. (B) The migration or invasion rate of SGC7901 cells. (C-D) The expression levels of E-cadherin, N-cadherin, vimentin, MMP-2 and MMP-14 in SGC7901 cells were detected by western blot. (*p < 0.05, **p < 0.01, ***p < 0.001, ns, no significance; ZFAS1, zinc finger antisense 1; EMT, epithelial-mesenchymal transition; MMP, matrix metalloproteinase).
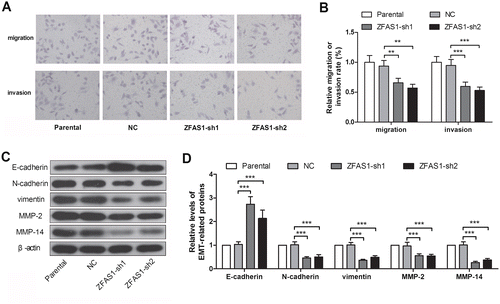
Figure 2. Knockdown of ZFAS1 suppressed the migration, invasion and EMT in gastric cancer cells. (A) The transwell assay images of SGC7901 cells with or without ZFAS1 knockdown. (B) The migration or invasion rate of SGC7901 cells. (C-D) The expression levels of E-cadherin, N-cadherin, vimentin, MMP-2 and MMP-14 in SGC7901 cells were detected by western blot. (*p < 0.05, **p < 0.01, ***p < 0.001, ns, no significance; ZFAS1, zinc finger antisense 1; EMT, epithelial-mesenchymal transition; MMP, matrix metalloproteinase).

Figure 3. Knockdown of ZFAS1 augmented the drug-induced proliferation suppression in gastric cancer cells. (A-B) The viability of SGC7901 cells treated with grading concentrations of cis-platinum (A) or paclitaxel (B) was detected by CCK-8 assay. (C) The expression level of ZFAS1 in SGC7901 cells treated with cis-pltinum (0.106 μM) or paclitaxel (4.394 μM) was detected by real-time PCR. (D-E) The viability of SGC7901 cells treated with cis-pltinum (0.106 μM) (D) or paclitaxel (4.394 μM) (E) or/and ZFAS1 knockdown was detected with CCK-8 assay (the data were compared with NC + cis-platinum or NC + paclitaxel group). (F) The colony formation images of SGC7901 cells treated with cis-platinum or paclitaxel. (G-H) The colony formation rate of SGC7901 cells with or without cis-platinum (G) or paclitaxel (H) treatment. (*p < 0.05, **p < 0.01, ***p < 0.001, ns, no significance; ZFAS1, zinc finger antisense 1).
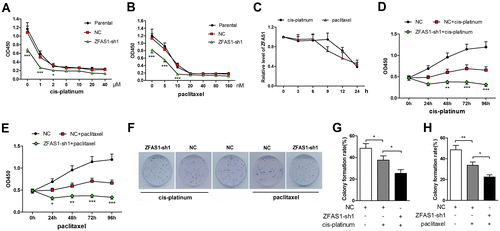
Figure 3. Knockdown of ZFAS1 augmented the drug-induced proliferation suppression in gastric cancer cells. (A-B) The viability of SGC7901 cells treated with grading concentrations of cis-platinum (A) or paclitaxel (B) was detected by CCK-8 assay. (C) The expression level of ZFAS1 in SGC7901 cells treated with cis-pltinum (0.106 μM) or paclitaxel (4.394 μM) was detected by real-time PCR. (D-E) The viability of SGC7901 cells treated with cis-pltinum (0.106 μM) (D) or paclitaxel (4.394 μM) (E) or/and ZFAS1 knockdown was detected with CCK-8 assay (the data were compared with NC + cis-platinum or NC + paclitaxel group). (F) The colony formation images of SGC7901 cells treated with cis-platinum or paclitaxel. (G-H) The colony formation rate of SGC7901 cells with or without cis-platinum (G) or paclitaxel (H) treatment. (*p < 0.05, **p < 0.01, ***p < 0.001, ns, no significance; ZFAS1, zinc finger antisense 1).

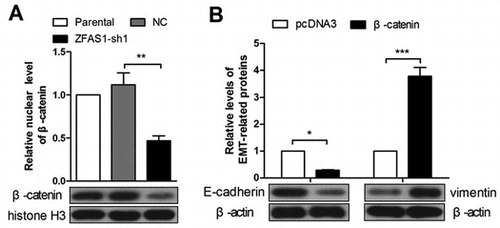
Figure 4. Wnt canonical signaling was modulated by ZFAS1 expression changes. (A) The mRNA level of β-catenin in SGC7901 cells with or without ZFAS1 knockdown was detected by real-time PCR. (B-C) The nuclear β-catenin level, cellular p-GSK3β, GSK3β and NKD2 levels in SGC7901 cells with or without ZFAS1 knockdown were detected by western blot. (D) The expression level of β-catenin in SGC7901 cells was detected with immunofluorescence assay. (E) The ZFAS1 level in SGC7901 cells after ZFAS1 overexpression was detected by real-time PCR. (F) The mRNA level of β-catenin in SGC7901 cells after ZFAS1 overexpression. (G-H) The nuclear β-catenin level, cellular p-GSK3β, GSK3β and NKD2 levels in SGC7901 cells with or without ZFAS1 overexpresion were detected by western blot. (*p < 0.05, **p < 0.01, ***p < 0.001, ns, no significance; ZFAS1, zinc finger antisense 1; NKD2, naked cuticle homolog 2; GSK3β, glycogen synthase kinase 3 beta).
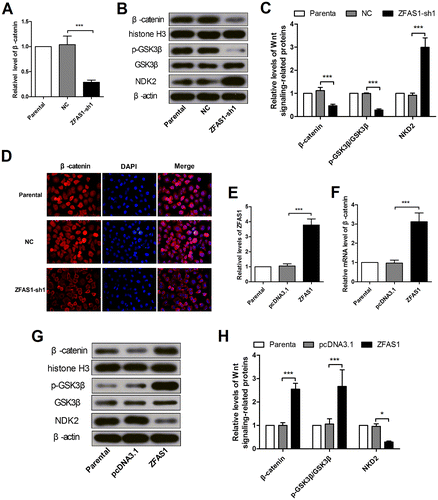
Figure 4. Wnt canonical signaling was modulated by ZFAS1 expression changes. (A) The mRNA level of β-catenin in SGC7901 cells with or without ZFAS1 knockdown was detected by real-time PCR. (B-C) The nuclear β-catenin level, cellular p-GSK3β, GSK3β and NKD2 levels in SGC7901 cells with or without ZFAS1 knockdown were detected by western blot. (D) The expression level of β-catenin in SGC7901 cells was detected with immunofluorescence assay. (E) The ZFAS1 level in SGC7901 cells after ZFAS1 overexpression was detected by real-time PCR. (F) The mRNA level of β-catenin in SGC7901 cells after ZFAS1 overexpression. (G-H) The nuclear β-catenin level, cellular p-GSK3β, GSK3β and NKD2 levels in SGC7901 cells with or without ZFAS1 overexpresion were detected by western blot. (*p < 0.05, **p < 0.01, ***p < 0.001, ns, no significance; ZFAS1, zinc finger antisense 1; NKD2, naked cuticle homolog 2; GSK3β, glycogen synthase kinase 3 beta).

Figure 5. ZFAS1 silencing-induced malignancy suppression was reversed by β-catenin ectopic overexpression. (A) The levels of β-catenin mRNA and protein in SGC7901 cells after β-catenin overexpression. (B-C) The transwell assay was performed to detect the migration and invasion in ZFAS1-silenced SGC7901 cells after ectopic expression of β-catenin. (D-E) The expression level of E-cadherin and vimentin in ZFAS1-silenced SGC7901 cells after β-catenin overexpression. (F) The viability of ZFAS1-silenced SGC7901 cells with cis-platinum or paclitaxel treatment as well as forced expression of β-catenin was detected by CCK-8 assay. (*p < 0.05, **p < 0.01, ***p < 0.001, ns, no significance; ZFAS1, zinc finger antisense 1).
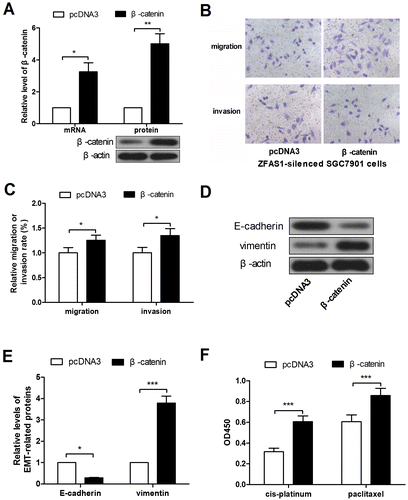
Figure 5. ZFAS1 silencing-induced malignancy suppression was reversed by β-catenin ectopic overexpression. (A) The levels of β-catenin mRNA and protein in SGC7901 cells after β-catenin overexpression. (B-C) The transwell assay was performed to detect the migration and invasion in ZFAS1-silenced SGC7901 cells after ectopic expression of β-catenin. (D-E) The expression level of E-cadherin and vimentin in ZFAS1-silenced SGC7901 cells after β-catenin overexpression. (F) The viability of ZFAS1-silenced SGC7901 cells with cis-platinum or paclitaxel treatment as well as forced expression of β-catenin was detected by CCK-8 assay. (*p < 0.05, **p < 0.01, ***p < 0.001, ns, no significance; ZFAS1, zinc finger antisense 1).

Reprints and Corporate Permissions

Please note: Selecting permissions does not provide access to the full text of the article, please see our help page How do I view content?

To request a reprint or corporate permissions for this article, please click on the relevant link below:

Academic Permissions

Please note: Selecting permissions does not provide access to the full text of the article, please see our help page How do I view content?

Obtain permissions instantly via Rightslink by clicking on the button below:

If you are unable to obtain permissions via Rightslink, please complete and submit this Permissions form. For more information, please visit our Permissions help page.