Figures & data
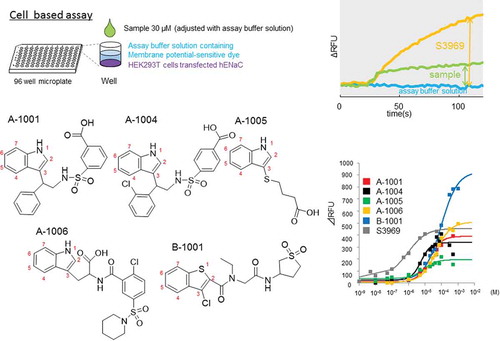
Figure 1. The screening procedure. (a) Cell based assay (1st screening). Compounds were selected where (ΔRFUcompound (30 μM) - ΔRFUassay buffer solution)/(ΔRFUS3969(1 μM) - ΔRFUassay buffer solution) > 0.18. (a) In our electrophysiological assay (2nd screening), compounds (n = 2) were selected where Δ I compound (30 μM)/Δ I amiloride (1 μM) > 0.3. S3969 and amiloride were used as positive and negative controls of the experiment, respectively. See methods for further details.
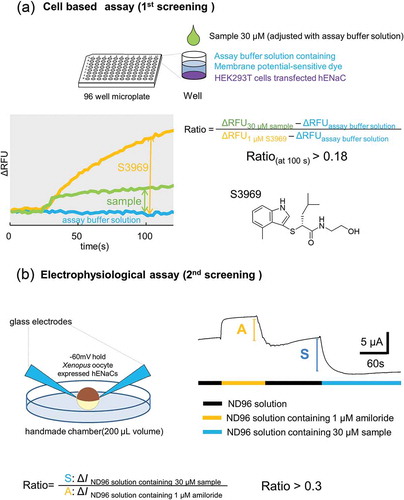
Figure 2. Chemical structure of the identified compounds. (a) Scheme of this screening. Two compounds (A-1001 and B-1001) were selected from 5434, and nine (six and three) compounds were selected from 666 (319 for A-1001 and 347 for B-1001) compounds having structures similar to the first two compounds. Marks show the compounds used for further experiments. (b) Structures of potential hENaCαβγ activators exhibited to the further experiment (, ). Structures of unmarked compounds were shown in Supplementary Figure 1. Score shows average in screening respectively (cell means 1st screening using cell based assay, oocyte means 2nd screening using electrophysiological assay).
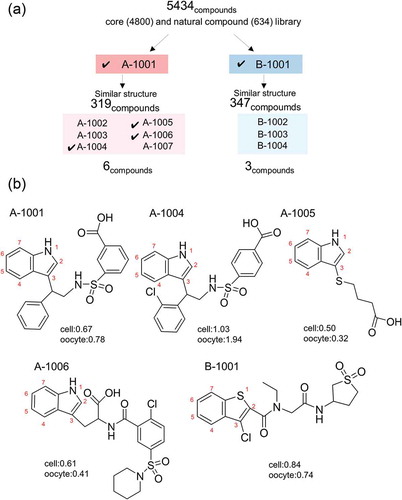
Figure 3. Dose-dependent activation of human ENaCαβγ channel by the compounds. (a) Dose-response relationships for the five selected compounds using a cell-based assay. Each point represents the mean ± S.E. from six independent measurements. Responses are indicated as ΔRFU. (b) Half- maximal effective concentration (EC50) and maximum effect value (Emax) of the five compounds were obtained by fitting the data to Hill’s equation. Colors indicate five compounds (A-1001; red, A-1004; black, A-1005; green, A-1006; yellow, B-1001; blue and S3969; gray).
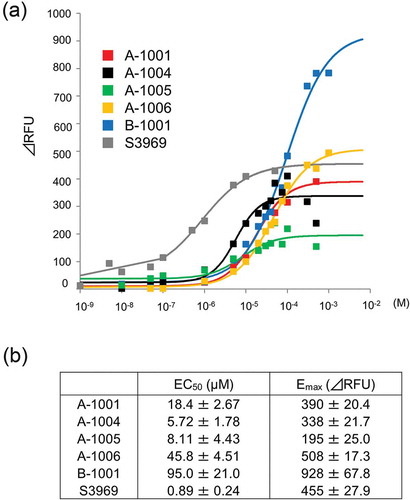
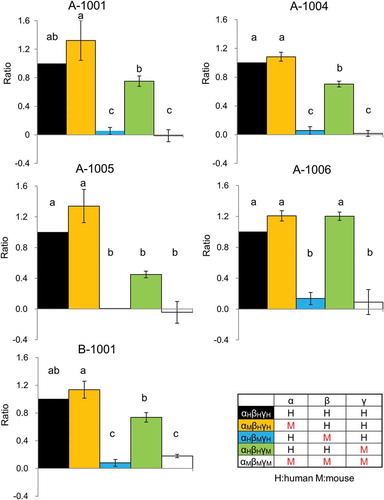
Figure 4. Effect of ENaCαβγ subunit composition on the modulatory activity of compounds. Each chimeric ENaC activation level shown was calculated as a ratio to the response value as follows:ΔRFUchimeric ENaCαβγ each compound(30 μM)/ΔRFUhENaCαβγ each compound(30 μM) Each value represents the mean ± S.E. Same letters indicate non-significant values according to the Tukey-Kramer test (p < 0.05; n = 4 for each). Colors indicate chimeric trimer combination (αHβHγH shows human ENaC(hENaC)αβγ; black, αMβHγH mouse ENaC(mENaC)α, hENaCβ and γ; yellow, αHβMγH shows hENaCα, γ and mENaCβ; blue, αHβHγM hENaCα,β and mENaCγ; green, αMβMγM mENaCαβγ; white).