Figures & data
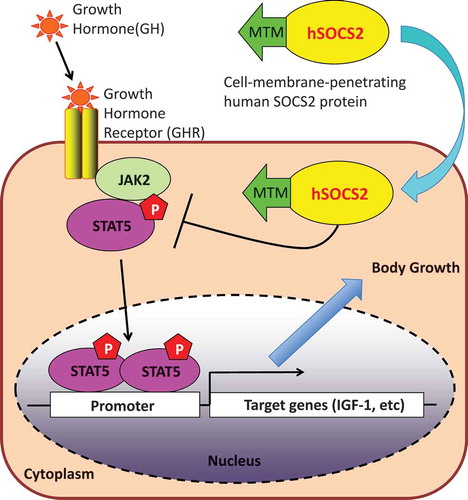
Table 1. Purification of recombinant human SOCS2 proteins from E. coli.
Figure 1. Schematic representation, purification and intercellular delivery of recombinant hSOCS2 proteins.
(a) Structure and design of recombinant human suppressor of cytokine signaling (SOCS) 2 proteins containing MTM (AAVLLPVLLAAP, green) and 6 × histidine tag (orange). (b) Expression and purification of recombinant hSOCS2 proteins were analyzed by sodium dodecyl sulfate polyacrylamide gel electrophoresis (SDS-PAGE) and stained with Coomassie Brilliant Blue (CBB, top). (c) Intracellular localization of recombinant hSOCS2 proteins (top) and differential interference contrast (DIC) image (bottom) were analyzed by confocal laser scanning microscopy. C and D, MCF-7 cells were incubated for 1 h in the absence or presence of fluorescein isothiocyanate (FITC)-labeled SOCS2 proteins at 0.5 μM. (d) FITC-labeled cells were analyzed by flow cytometry. (e) Induction efficiency of MTM-SOCS2 was analyzed by Western blotting under concentration-dependent conditions.
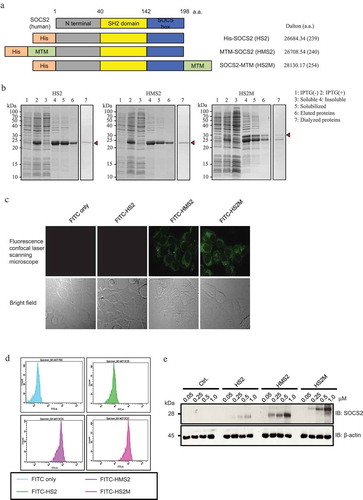
Figure 2. Suppression of cell proliferation by MTM-SOCS2 in several cancer cell lines.
(a–h) Cell proliferation was measured by counting the number of cells on the indicated number of days after stimulation with either growth hormone (GH) or insulin-like growth factor 1 (IGF-1). (i) The cell-cycle distribution of MCF-7 cells was examined by propidium iodide (PI) staining using a flow cytometer. Percentages of G1, S, and G2/M cells are indicated. Data represent the mean ± standard error; repeated with three independent experiments; *p < 0.05.
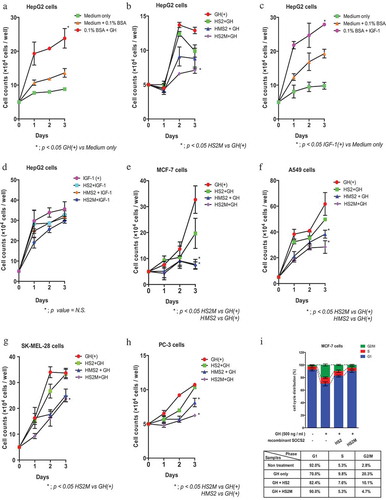
Figure 3. Interaction of CP-SOCS2 with growth hormone receptor (GHR).
(a) Interaction of synthesized Flag-tagged Tyr-595-phosphorylated GHR peptides with HEK293T cell-expressed SOCS2 was analyzed by an immunoprecipitation (IP)–Western blotting assay (upper panel). The expression of 6xMyc-tagged SOCS2 in HEK293T cells was analyzed by Western blotting (lower panel). (b) Interaction between the synthesized GHR peptides (un-phosphorylated, left panel; phosphorylated, right panel) and the recombinant SOCS2 proteins was analyzed by an IP–Western blotting assay. (c) Interaction of the recombinant SOCS2 proteins with HEK293T cells expressing GHR-Myc-Flag were analyzed by an IP–Western blotting assay (upper panel). Immunoprecipitated GHR (middle panel) and actin-β expression (lower panel, as a control) were also examined by Western blotting.
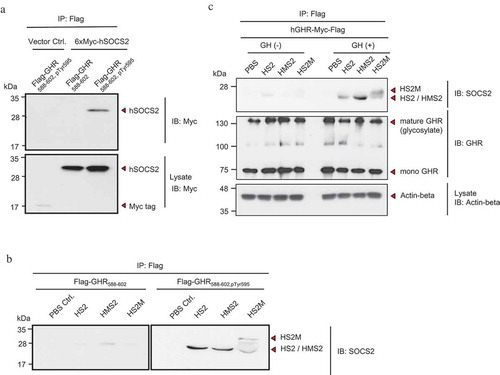
Figure 4. Inhibition of the GH target gene expression by MTM-SOCS2 proteins.
(a) Lysates of recombinant SOCS2-treated and GH-stimulated HepG2 cells were prepared and phosphorylation of STAT5 at Tyr-694(5A)/699(5B) was analyzed by an IP-Western blotting assay. (b) Suppression of Janus kinase–signal transducer and activator of transcription (JAK2–STAT) signaling by MTM-SOCS2 proteins in HepG2 cells was analyzed by a luciferase assay. (c–f) The mRNA levels of indicated GH target genes were analyzed by quantitative reverse-transcription polymerase chain reaction (qRT-PCR). All experiments were performed independently, in triplicate. Data are expressed as means ± standard error, *p < 0.05.