Figures & data
Figure 1. The effects of PaTx-1 (100 nM), a selective Kv4.2 and Kv4.3 channel blocker, on firing frequency and membrane potential of PVN oxytocin neurons.
(a) A representative recording of membrane potential from the neuron reacted to PaTx-1. The black bar indicates the duration of PaTx-1 application. (b) A ratemeter for the effect of PaTx-1. The black bar indicates the PaTx-1 application. (c) An interspike interval histograms for control (white bar) and under PaTx-1 (black). (d, e) Changes in firing frequency (d) and membrane potential (e) of all investigated neurons (n = 19) before and after PaTx-1 application. (f) A Scatter plot of the change in firing frequency and membrane potential in all recorded neurons (n = 19). The dotted line indicates 1 Hz. (g, i) The effects of PaTx-1 on firing frequency and membrane potential of PVN oxytocin neurons in the activated group (n = 6, paired t-test, **p < 0.01, ***p < 0.001). (h, j) The effects of PaTx-1 on firing frequency and membrane potential of PVN oxytocin neurons in the non-activated group (n = 13, paired t-test). Data are presented as means ± SEM. PaTx-1: phrixotoxin-1, PVN: paraventricular nucleus.
Figure 2. The effects of PaTx-1 (100 nM), a selective Kv4.2 and Kv4.3 channel blocker, on action potential half-width in PVN oxytocin neurons.
(a, b) Representative membrane potential recordings from PVN oxytocin neurons before (left) and after (right) PaTx-1application in the activated (a) and non-activated (b) groups. Black bars indicate the expanded time scale area for the enlarged action potential shown in the inset. The bar in the inset shows the half-width of action potential used for the analysis. (c) The effects of PaTx-1 on half-width of action potential of PVN oxytocin neurons in the activated group (n = 6, paired t-test, **p < 0.01). (d) The effects of PaTx-1 on the action potential half-width of PVN oxytocin neurons in the non-activated group (n = 9, paired t-test). Data are presented as means ± SEM. PaTx-1: phrixotoxin-1, PVN: paraventricular nucleus.
Figure 3. Measurements of A-type currents of PVN oxytocin neurons.
(a) A voltage protocol for measurement of A-type currents of PVN oxytocin neurons. Recorded cells were held at −90 mV and the currents were evoked by 400 ms voltage depolarization to voltage values between −70 to −35 mV in 5 mV increments under presence 30 mM TEA (b) A representative A-type current of PVN oxytocin neurons. (c) A current-voltage relationship curve of A-type currents of PVN oxytocin neurons (n = 8).
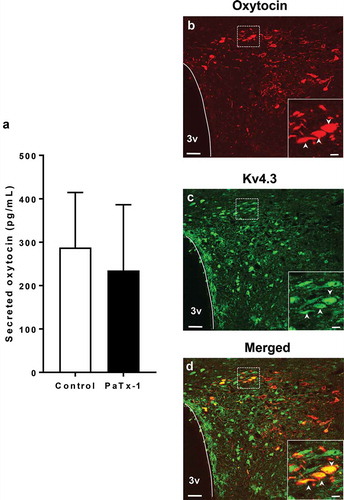
Figure 4. Measurements of secreted oxytocin from brain slices including the PVN region and expression of oxytocin and Kv4.3 in the PVN region.
(a) The effect of PaTx-1 (100 nM) on oxytocin release from brain slices including the PVN region (n = 4 each, student’s t-test). (b–d) Confocal images of double immunofluorescence for oxytocin (red: b), Kv4.3 (green: c) and merged images (d). Scale bars = 50 μm. Enlarged image of the dotted square is shown in the lower right corners of b–d. The arrowheads in each image indicate the co-localized neurons, oxytocin and Kv4.3. Scale bars = 10 μm. PaTx-1: phrixotoxin-1, PVN: paraventricular nucleus, 3v: third ventricle.