Figures & data
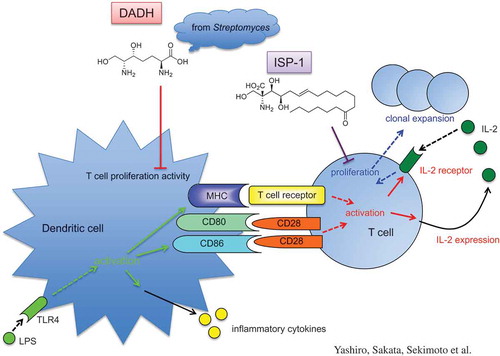
Figure 1. Effect of DADH on allogeneic T cell proliferation.
(a) Structures of DADH and myriocin (ISP-1). (b) Allogeneic DC-mediated proliferation of T cells. Pan T cells (C57BL/6) were co-cultured with BMDCs (BALB/c) in the presence or absence of 50 µg/mL (270 µM) DADH. O.D. refers to the uptake of BrdU in the nucleus of T cells. The results are shown as mean ± S.D. (n = 3). Similar results were obtained in two other independent experiments. Means indicated by different small letters are significantly different, based on Tukey-Kramer (p < 0.05).
Figure 2. Effect of DADH and ISP-1 on T cell proliferation induced by plate-coated Abs.
Purified splenic whole T cells were stimulated by plate-coated anti-CD3 Ab and anti-CD28 Ab.Number of CD4+ (a) and CD8+ T cells (b) was determined by flow cytometric analysis. The results are shown as mean ± S.D. (n = 3). Similar results were obtained in two other independent experiments. DADH (50 µg/mL = 270 µM) and ISP-1 (10 nM) was used with the concentration that exhibits suppressive effect in mixed lymphocyte reaction.Open bars, without stimulation; closed bars, stimulated with plate-coated Abs against CD3 and CD28. Means indicated by different small letters are significantly different, based on Tukey-Kramer (p < 0.05).
Figure 3. Suppressive effect of DADH on T cell proliferation activity of DCs.
(a) BrdU uptake into T cells co-cultured with DADH-treated BMDCs.
(b) Number of CD4+ T cells and CD8+ T cells co-cultured with DADH-treated BMDCs.
(c) Number of CD4+ T cells and CD8+ T cells co-cultured with ISP-1-treated BMDCs.
Open bars, number of CD4+; closed bars, number of CD8+ (B and C).
BMDCs were pre-incubated with DADH (a and b) or ISP-1 (c) for 42 h and incubated for an additional 6 h in the presence or absence of LPS. Number of T cells was determined by flow cytometric analysis. The results are shown as means ± S.D.s (n = 3). Similar results were obtained in two other independent experiments. Means indicated by different small letters (a), or small letters for CD4 and capital letters for CD8 (b and c) are significantly different, based on Tukey-Kramer (p < 0.05).
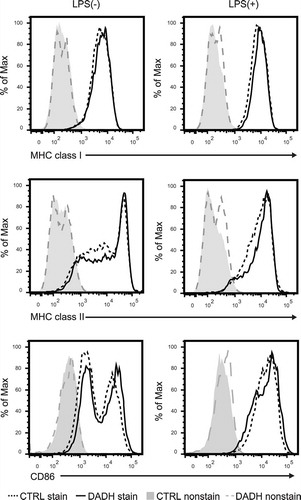
Figure 4. Expression levels of MHC and co-stimulatory molecules on DCs.
Cell surface expression levels of MHC class I, MHC class II, and CD86 molecules were determined by flow cytometric analysis. BMDCs were incubated in the presence (DADH) or absence (CTRL) of DADH for 42 h and then treated with (right panel) or without (left panel) LPS for an additional 6 h. stain, stained with specific Abs; nonstain, without Ab-treatment. Typical profiles are shown, and similar results were observed in two independent experiments.